Black Friday is still the biggest shopping day of the year, though trends have evolved in recent years in response to new online offerings and the COVID-19 pandemic.
To give you the full picture of Black Friday, we’ve compiled the most interesting Black Friday statistics based on 2022 numbers and 2023 predictions.
By understanding these trends, you’ll have a good sense of what to expect this Black Friday and how to prepare your own business for success.
⚡Check also ➡️ 10 Best WordPress Black Friday Deals
Black Friday Shopper Statistics
In 2022, Black Friday had a whopping 87.2 million online shoppers and 72.9 million in-store shoppers, accounting for a total of over 160 million Black Friday shoppers in the US.
Thanksgiving Weekend In-Store and Online Shoppers in the US (by Day)
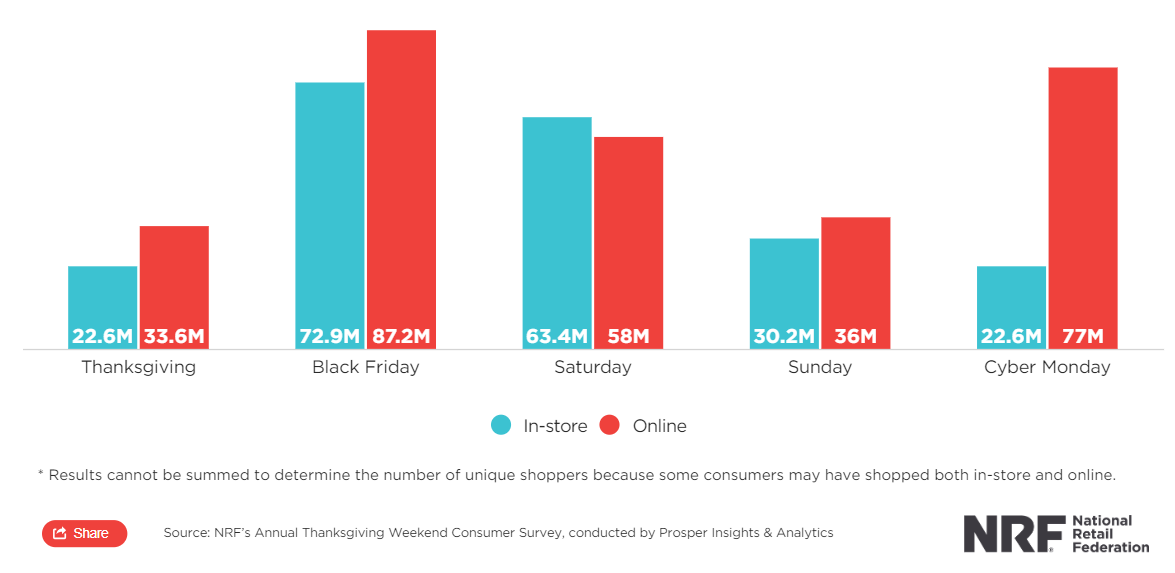
In particular, Cyber Monday saw an impressive 77 million online shoppers.
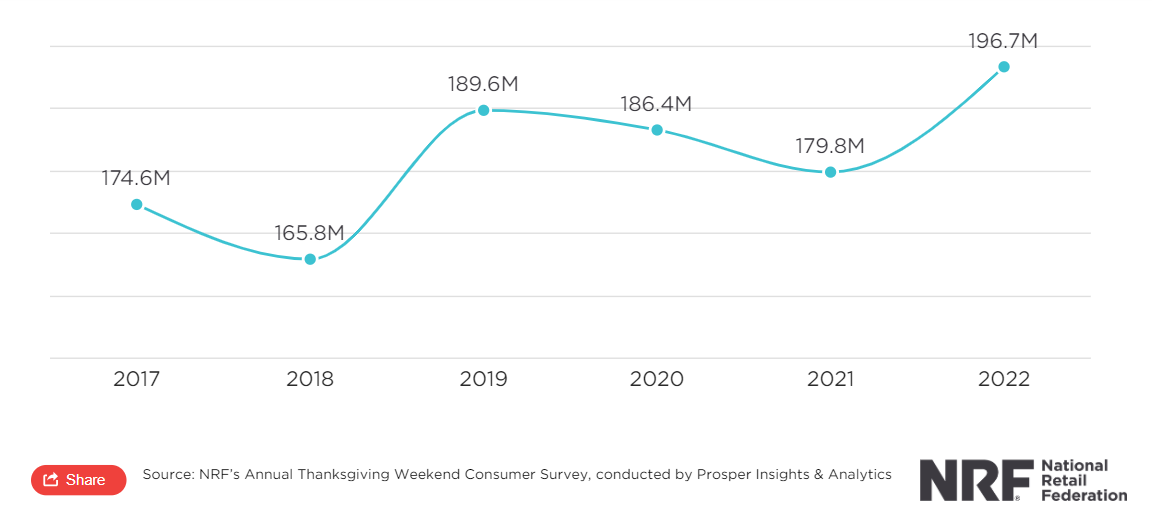
When considering the entire Thanksgiving shopping weekend, 2022 saw 196.7 million unique US shoppers total, which exceeded expectations by over 30 million.
Thanksgiving Weekend Shoppers in the US (2017-2022)
It was noted that individual spending also saw an uptick; shoppers spent an average of $325.44 on holiday purchases, an increase from 2021’s average of $301.27.
Black Friday Sales Statistics
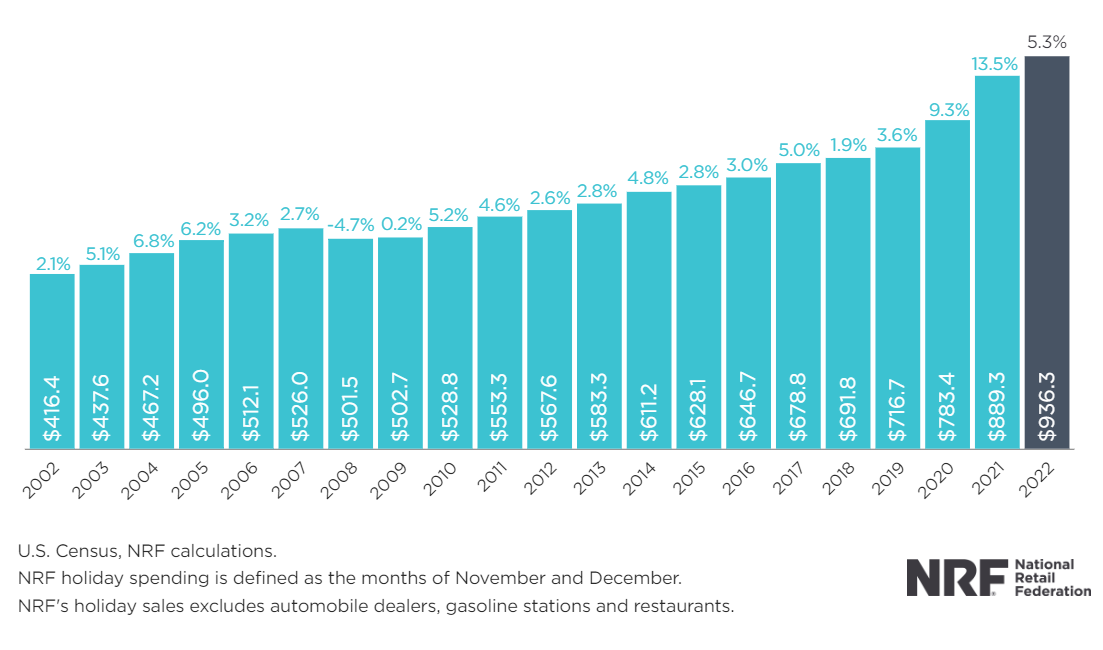
In 2022, holiday retail sales in the US reached $936.3 billion, which is a 5.3% growth.
Historical Holiday Sales in the US (From 2002 to 2022)
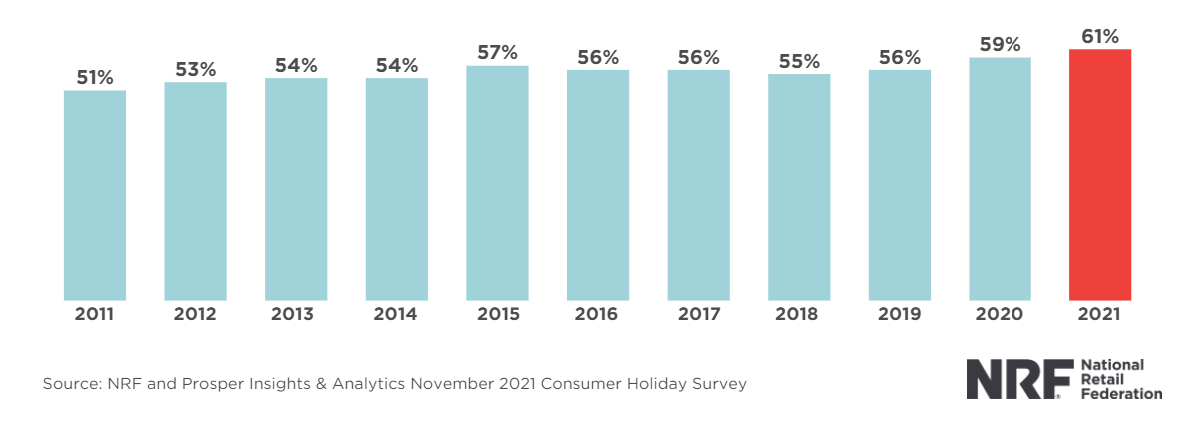
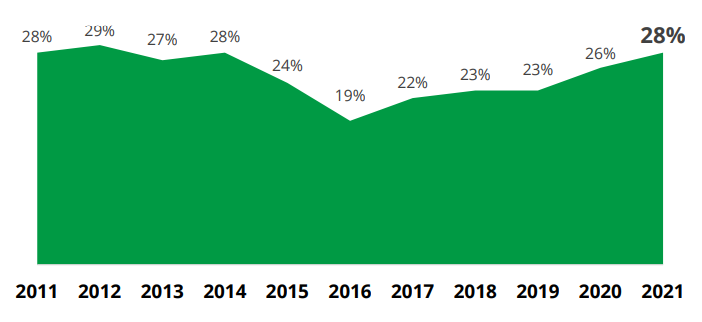
In fact, 61% of consumers in the U.S. started their holiday shopping in early November in 2021, and sales were up 13.6% in November of that year compared to November 2020.
Percent of U.S. Consumers, Who Started Shopping by Early November (From 2011 to 2021)
In 2022, there were 5% fewer first-time shoppers compared to 2021, but the number of people who shopped for the fifth time or more increased by 17%.
New customers spent about $128 on their orders, and people who shopped again spent close to $118.
Average Order Values Change by Buyer Type on Black Friday 2022
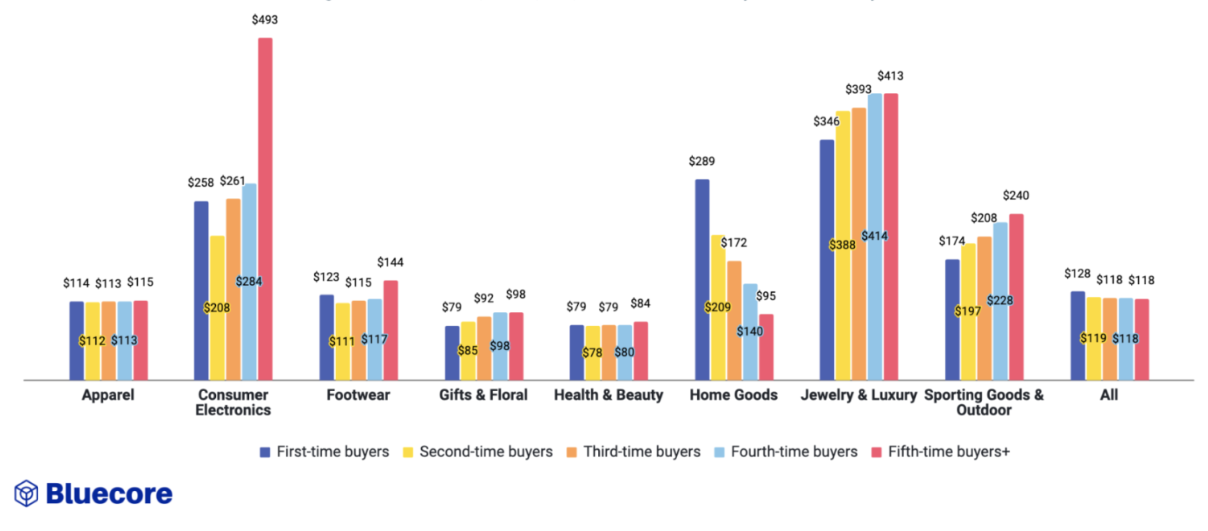
However, shoppers who came back for the fifth time or more to buy electronics or home items spent a lot – on average $493.
New buyers in these categories also spent quite a bit, averaging $289 per order.
Popular Black Friday Trends
It’s also important to highlight other Black Friday trends that surged in 2021, including:
1. Cyber Monday has become the biggest online shopping day of the year, with a total spend of $10.7 billion in 2021. (This is just shy of 2020’s record of $10.8 billion.) At peak times, consumers spent $12 million every minute during Cyber Monday.
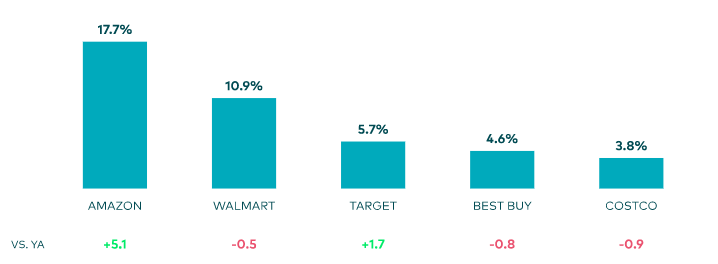
2. Amazon was a top Black Friday retailer for the second year in a row, accounting for 17.7% of all sales. Walmart, Target, Best Buy, and Costo were also top earners.
2021 Black Friday Top Retailers
3. Pickup options are key to consumers. Retailers who offered pickup grew revenue by 50% more compared to those who didn’t.
4. Out-of-stock items surged in 2021, with 40% of electronics out-of-stock and overall out-of-stock messages up by 250%.
Black Friday Shopper Behavior Statistics
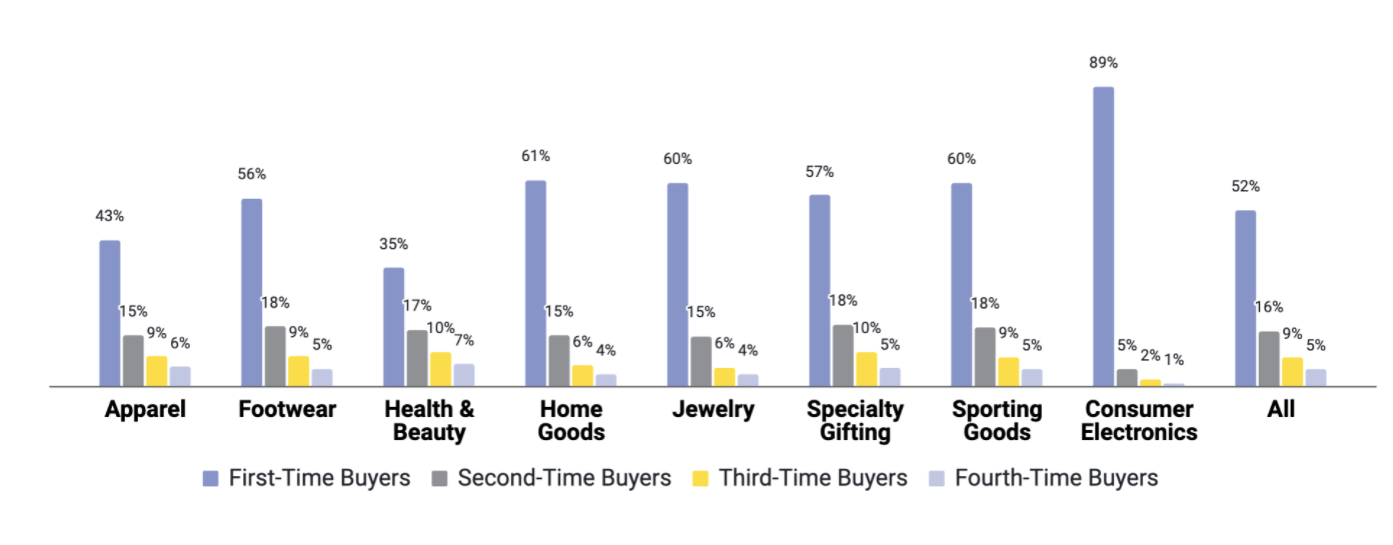
Black Friday shoppers in 2021 also had a unique profile with 52% first-time buyers. In the electronics category, this was even more pronounced with 89% first-time buyers.
Percentage of Repeat Customers & First-Time Buyers on Black Friday 2021
In addition, shoppers in 2021 had the following characteristics:
- 58% of purchases on Black Friday were impulse buys.
- Black Friday shoppers viewed 5.28 products on average.
- 27% of shoppers choose to shop in-store because of the excitement of it.
What’s more, there were several key factors that influenced shopper behavior on Black Friday.
Besides the price, which swayed 86% of consumers to purchase, shoppers were interested in free shipping (49%), promotions (36%), an easy-to-use website/app (21%), and store pick-up (20%).
Black Friday Shopper Demographic Statistics
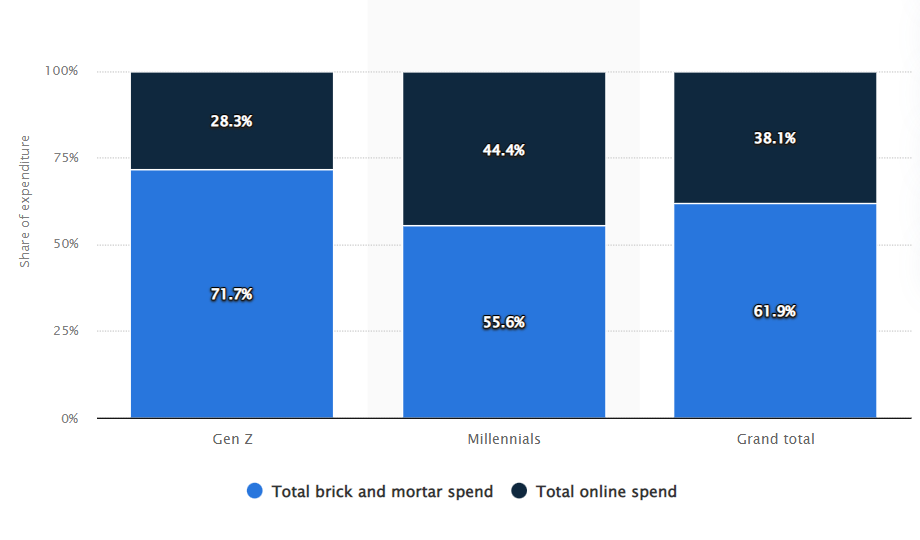
In addition, millennials were the biggest online spenders on Black Friday 2021 in the U.S. What’s more, they led online shopping with nearly 45% of purchases happening on the internet.
2021 Black Friday Shoppers Demographics in the U.S.
Some other key shopper demographics for 2021 included:
- Gen Z preferred to shop in-store, with nearly 72% buying in brick-and-mortar stores.
- 29% of women intended to shop during Black Friday 2021.
- Overall, 38% of total shoppers choose to purchase online.
Black Friday Popular Industries & Items Statistics
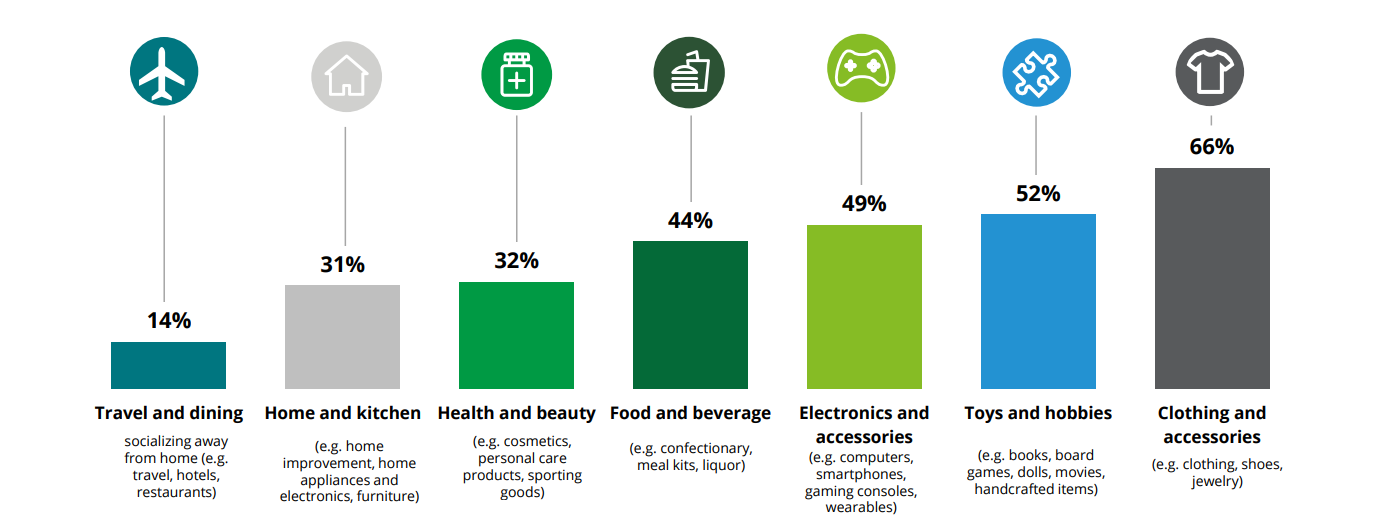
For holiday shopping, the most popular category remains clothing and apparel at 66%, with toys at 52% and electronics at 49%.
Thanksgiving Shopping by Industry
In fact, shoppers tend to browse apparel the most of any other category, viewing 8.54 products about 17.97 times on average.
Apparel is also best at gaining recapturing buyers, with 5.96% repeat customers from earlier in the year.
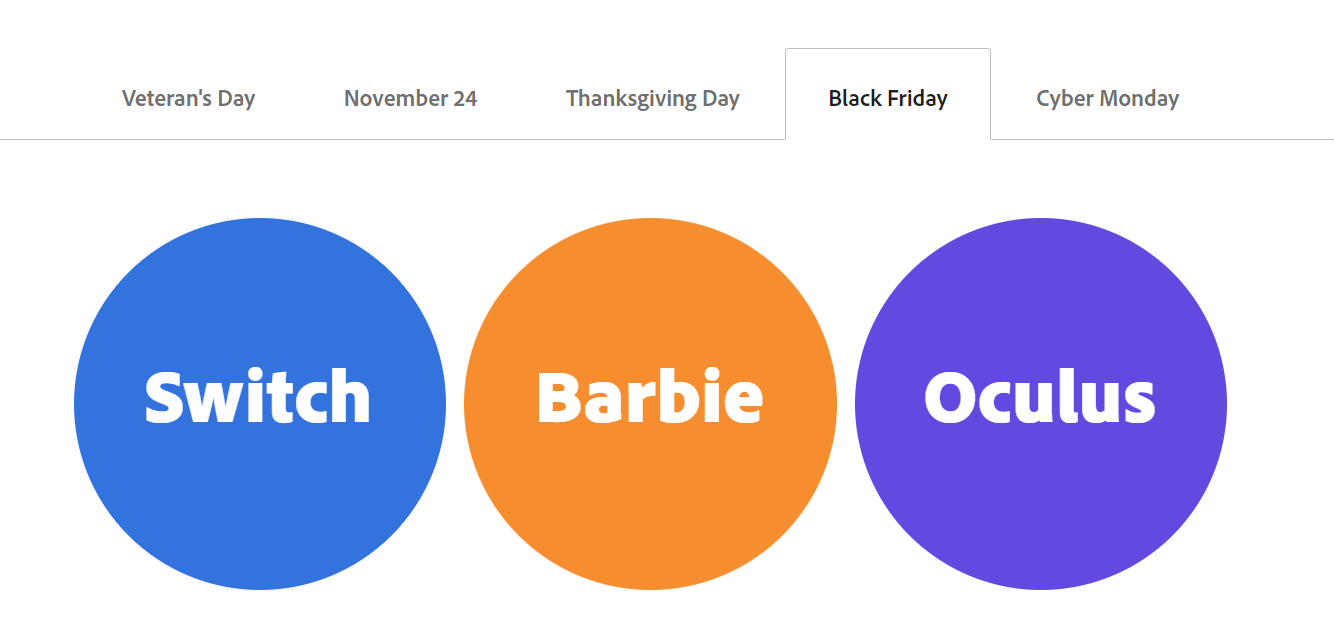
In addition, the top three trending items for Black Friday 2021 were the Switch, Barbie, and Oculus, though popular products are sure to change in 2022.
Top Trending Products for Black Friday 2021 in the U.S.
Black Friday Online Traffic Statistics
To start, a new record of nearly 42.4% of Black Friday sales happened on mobile phones and 58% were made on desktop devices. Interestingly enough, conversion rates were also higher on desktops at 6.9%.
That said, Black Friday site traffic was 5% lower in 2021 compared to 2020, though still impressive for brands.
Across verticals, site traffic in 2021 was 110% higher than on a typical day.
According to the NRF, shoppers are also experiencing multichannel shopping journeys that mix different channels according to whether they’re learning about the product, browsing for it, or buying it.
The Multichannel Shopping Journey
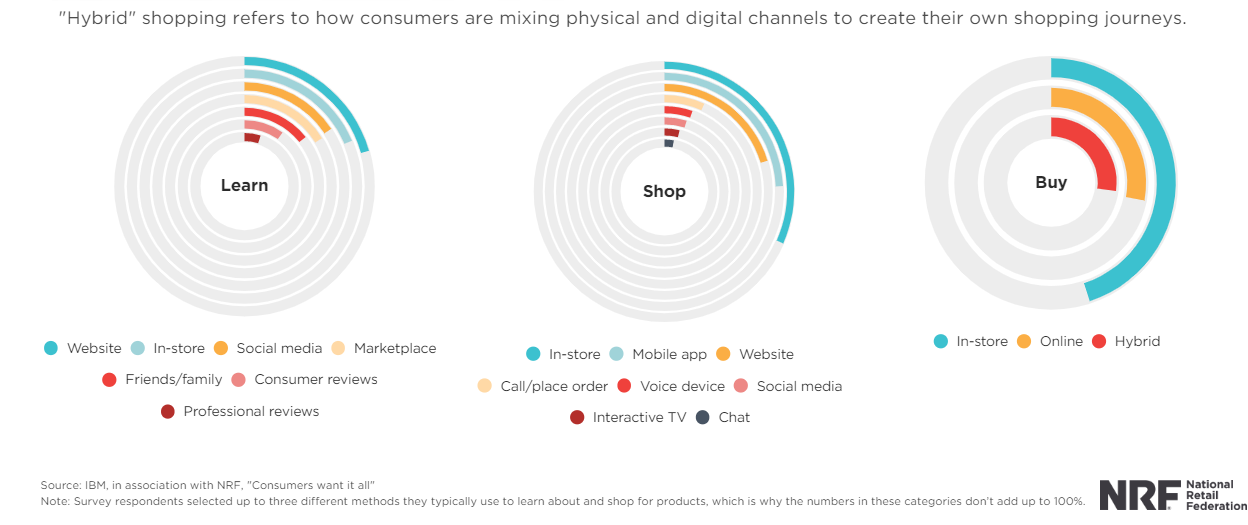
For example, 32% of shoppers are using social media to learn about products, while 50% are using a mobile app to browse products and 27% are using hybrid online and in-store methods to purchase.
Black Friday Social Media & Marketing Statistics
What’s more, social media has become essential to Black Friday’s success.
For example, 56% of shoppers use social media to research products and 28% for holiday shopping.
Use of Social Media for Holiday Shopping (from 2011 to 2021)
79% of shoppers expect social media replies within 24 hours.
In addition, SMS is becoming a highly effective marketing technique, surpassing email efforts.
For Cyber Week, SMS grew 83% as a method for brands, compared to 15% for email.
Even so, 116.5 million emails were sent on Black Friday, more than any other.
⚡Check also ➡️ 14 Best Black Friday & Cyber Monday Web Hosting Deals
Black Friday Worldwide Statistics
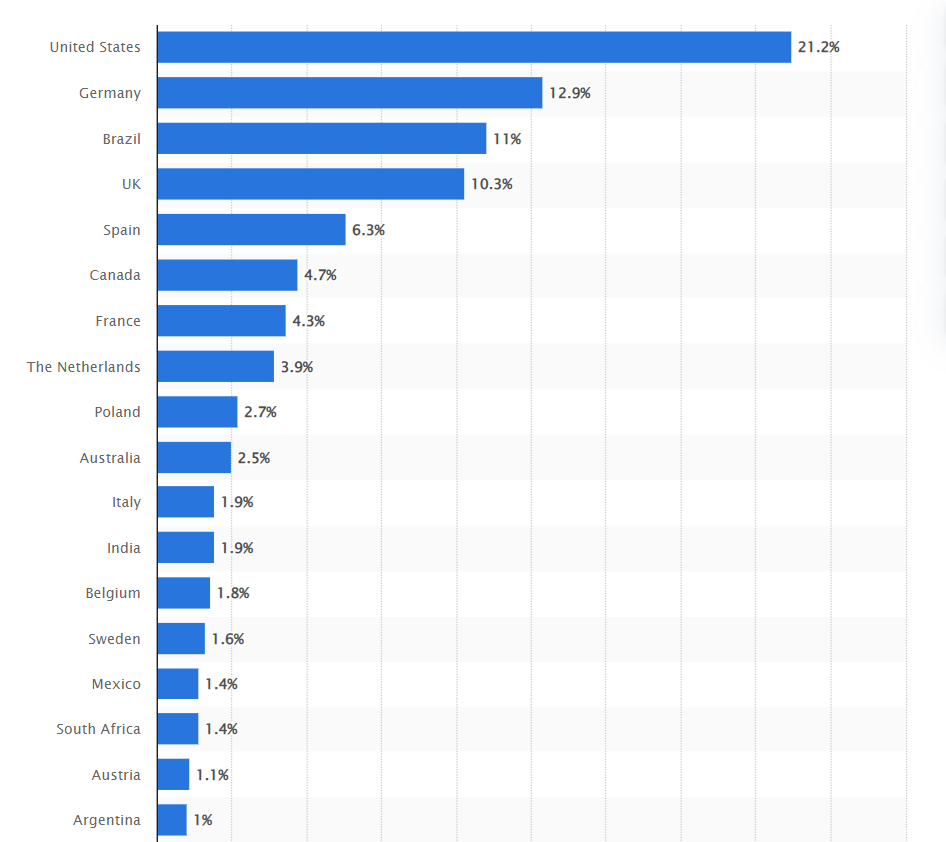
Black Friday is also a worldwide event, though its presence is strongest in the U.S.
According to traffic searches on Black Friday, the U.S. held 21% of traffic, while Germany, Brazil, and the U.K. had more than 10% of all searches.
Leading Countries Searching for Black Friday in 2021
Every country has its own trends in terms of shopping channels, too. Online-only shopping was especially popular in the U.K. (48%) and Israel (46%).
Finally, some Black Friday purchases are crossing borders, with 15% of Shopify orders being sent to other countries.
2023 Black Friday Predictions
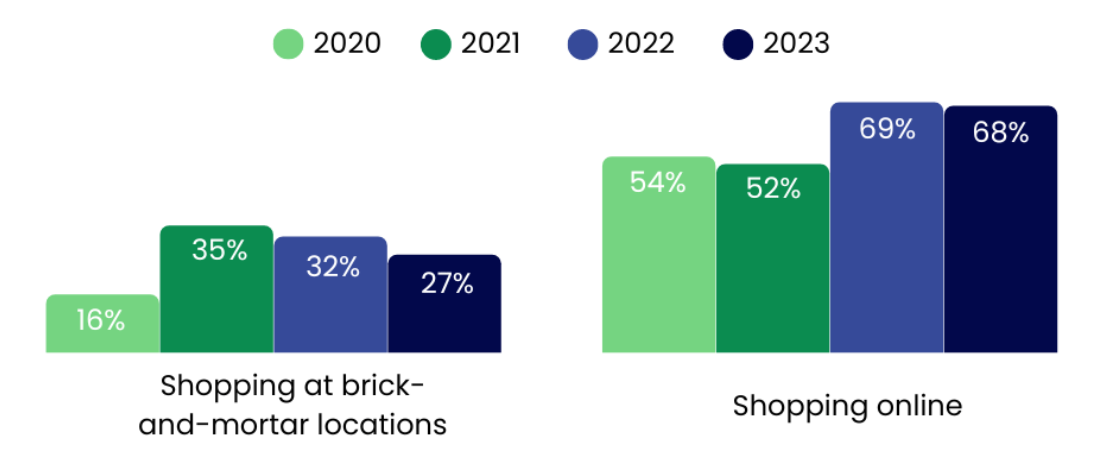
According to Drive Research, in 2023, more than two-thirds (or 68%) of US shoppers plan to buy their Black Friday deals online. In contrast, only about a quarter of them, or 27%, will go to actual stores to shop, which is 16% less than last year.
Distribution of Online and In-Person Shopping for Black Friday in the US (From 2020 to 2023)

For those who do hit the stores on Black Friday, most are heading to Target and Walmart, with 67% going to Target and nearly as many, 66%, shopping at Walmart.
As for online shopping during the big Cyber Week sales, Amazon, Target, and Walmart are the top spots where most people will be clicking to buy.
Meanwhile, this year is shaping up to be pricier than last: about 23% of US shoppers are ready to spend $1,000 or more on their holiday buys, which is 15% more people than last Black Friday.
Holiday Spending in the US (From 2020 to 2023)
Also, more people are getting an early start on their Black Friday shopping—35% will begin on Thanksgiving, which is up 13% from the previous year.
And finally, more than half of the shoppers, 54% to be exact, say they’re more likely to shop at stores that let them buy online and then pick up their items in store.
Get Black Friday Statistics and More with Siteefy
Will Black Friday in 2023 follow these predictions? We’ll have to wait to find out!
In the meantime, you can get a better sense of shopping trends for the holiday season with these powerful Black Friday statistics.
As you prepare your eCommerce website for Black Friday shoppers, be sure to keep in mind these top stats and get even more tips on Siteefy’s blog!
🔔 Check also:
- 25+ Website Statistics That Will Intrigue You
- 101+ Internet Marketing Statistics, Facts, and Trends (2022)
- 167+ Internet Statistics, Trends and Facts [Mobile Included]
- 135+ Important Mobile Marketing Statistics & Facts
- Content Marketing Statistics, Facts and Trends
- 100+ Video Marketing Statistics, Facts and Trends
Sources:
- https://nrf.com/media-center/press-releases/nrf-says-2021-holiday-sales-grew-141-percent-record-8867-billion
- https://nrf.com/blog/6-things-know-about-2022-holiday-shopping-season
- https://nrf.com/media-center/press-releases/record-1967-million-consumers-shop-over-thanksgiving-holiday-weekend
- https://nrf.com/media-center/press-releases/nrf-says-2022-holiday-sales-grew-53-9363-billion
- https://nrf.com/media-center/press-releases/thanksgiving-draws-nearly-190-million-shoppers
- https://nrf.com/blog/3-key-factors-led-record-setting-holiday-season
- https://nrf.com/media-center/press-releases/nearly-180-million-shop-over-thanksgiving-holiday-weekend
- https://business.adobe.com/blog/the-latest/black-friday-sales-numbers-making-data-driven-decisions-for-2022
- https://news.adobe.com/news/news-details/2022/Adobe-Forecasts-209.7-Billion-Holiday-Season-Online-U.S.-Cyber-Monday-to-Top-11-Billion/default.aspx
- https://business.adobe.com/resources/sdk/adobe-2022-holiday-shopping-forecast.html
- https://www.bluecore.com/black-friday-cyber-monday-2022/
- https://blog.adobe.com/en/publish/2021/11/30/adobe-consumers-spent-10-8-billion-on-cyber-monday-109-8-billion-so-far-this-holiday-season
- https://blog.adobe.com/en/publish/2021/11/09/adobe-shoppers-have-seen-over-2-billion-out-of-stock-messages-online-october-2021
- https://www2.deloitte.com/content/dam/insights/articles/us164630_2021-holiday-retail-survey/DI_2021-Deloitte-holiday-retail-survey.pdf
- https://www2.deloitte.com/content/dam/insights/us/articles/6382_2019-holiday-survey/2019_pre-Thanksgiving-pulse-survey.pdf
- https://www2.deloitte.com/content/dam/insights/us/articles/6890_holiday_retail/6907_2020-pre-thanksgiving-findings.pdf
- https://www.bluecore.com/black-friday-2021-insights/
- https://www.numerator.com/holiday-trends/cyber-weekend
- https://www.statista.com/statistics/1276241/black-friday-online-searches-country/
- https://www.statista.com/statistics/956252/channels-consumers-plan-use-black-friday-purchases-selected-countries/
- https://www.statista.com/statistics/1292873/share-of-black-friday-spend-us-gen-z-gen-y/
- https://www.insiderintelligence.com/content/7-observations-black-friday-cyber-monday-2021
- https://www.salesforce.com/news/press-releases/2021/12/01/cyber-monday-black-friday-statistics-2021/
- https://www.campaignmonitor.com/resources/infographics/holiday-email-marketing-by-the-numbers/
- https://datawrapper.dwcdn.net/9jiVK/2/#embed