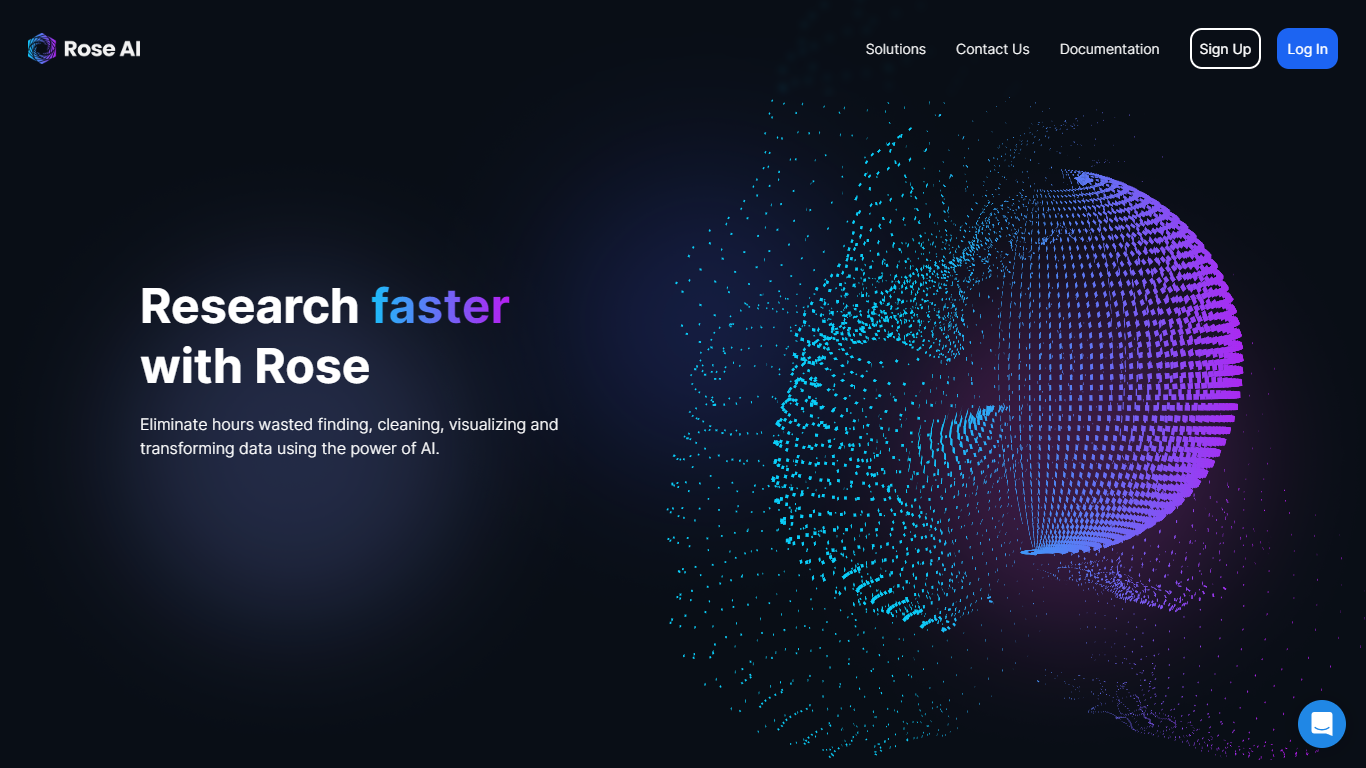
☑️ What is Rose?
Rose is an AI-powered cloud-based data visualization platform that helps users collect, transform, visualize, and share data.
🔗 Official website: Rose
Rose Reviews
🔑 Key Features
Data Integration: Rose seamlessly integrates with top data providers, making it easy to find relevant data for research.
Natural Language Processing (NLP): Rose parses and visualizes information based on human language prompts, eliminating manual search queries.
Infrastructure Tools: Rose provides tools for cleaning, analyzing, and visualizing data within their web application.
Data Marketplace: Users can preview, buy, and sell rich datasets with ease through Rose’s trusted third-party data marketplace.
Auditable Logic: Rose ensures transparency by allowing users to trace the logic behind its outputs back to the raw input data. This feature is particularly valuable for reliability and accountability.
Frictionless Sharing: Users can easily share insights with internal teams or third parties without unnecessary barriers. You can control permissions to share as much or as little data as needed.
🤓 How to use Rose?
- Access the Rose Web Platform: Sign in to your Rose account and navigate to the Rose Web Platform.
- Choose a Dataset: Select a dataset from the available options in Rose. You can either choose from the datasets already stored in Rose or upload your own.
- Run a Code Block: Type the rosecode (dataset) into a code module and click the play button or press “shift” + “enter” to run the code module.
- Visualize the Data: Once the code module is executed, you will see a chart representing the data. Hover over the line or change the timeline to explore the data in detail.
- Apply Transformations: If you want to apply transformations to the dataset, use the format “rosecode:transformation_name(optional_parameters)” to modify the data.
- Further Analysis: After applying transformations, you can visualize the modified dataset, perform additional transformations, or save it as a new rosecode for future use.
- Export and Share: If you are satisfied with your chart, you can export it as a PNG, PDF, or SVG file by selecting the appropriate option from the additional chart options menu. You can also download the data behind the rosecode as a CSV file.
📚 Rose Use Cases
- Data Analysis and Visualization: Rose allows users to analyze and visualize data from various sources, helping them gain insights and make informed decisions based on the visual representation of the data.
- Data Exploration and Discovery: With Rose , users can explore and discover patterns, trends, and relationships within their datasets, uncovering valuable insights that may not be apparent in raw data.
- Data Collaboration and Sharing: Rose facilitates collaboration by enabling users to share their visualizations and findings with others, promoting data-driven discussions and decision-making within teams or across organizations.
- Data Reporting and Presentations: Rose empowers users to create visually appealing and informative data reports and presentations, making it easier to communicate complex data findings to stakeholders and audiences.
- Data-driven Storytelling: With Rose, users can create compelling narratives and stories using data visualizations, enhancing the storytelling aspect of data analysis and making it more engaging for the audience.
- Data Integration and Transformation: Rose allows users to integrate and transform data from multiple sources, enabling them to combine and manipulate datasets to extract meaningful insights and create comprehensive visualizations.
💲 Pricing
Monthly subscription – Upon Request
Rose FAQ
🔗 Links
Review Rose
Affiliate Disclosure
Siteefy content is free. When you purchase through our links, we may earn an affiliate commission.
