The Internet is a gigantic infrastructure that lets businesses, governments, and individuals manage thousands of different things online.
We all use it every day, but we don’t know so much about it.
To help you stay informed, we have collected, analyzed, and structured the most essential Internet statistics, trends, and data available today.
We present all our findings in this post below.
Chapter 1
Internet Usage
There are billions of active Internet users in the world. In this chapter, we look at how exactly the Internet is being used globally and how Internet users interact with the World Wide Web.

How Many People Use the Internet?
There are a total of 5.18 billion active Internet users in the World as of April 2023.
Global internet usage (penetration) has increased from roughly 30% in 2010 up to 58.99% in 2021.
As of January 2021, China has the highest number of internet users globally (with a 65.2 % online penetration and 939.8 million users).
Countries like India, Bangladesh, Ghana, and Malawi have doubled the number of internet users in the last 3 years alone.

97.0%
Northern Europe , Western Europe and Northern America have the highest internet adoption rate at 97.0%, 93.3% and 90.4%.
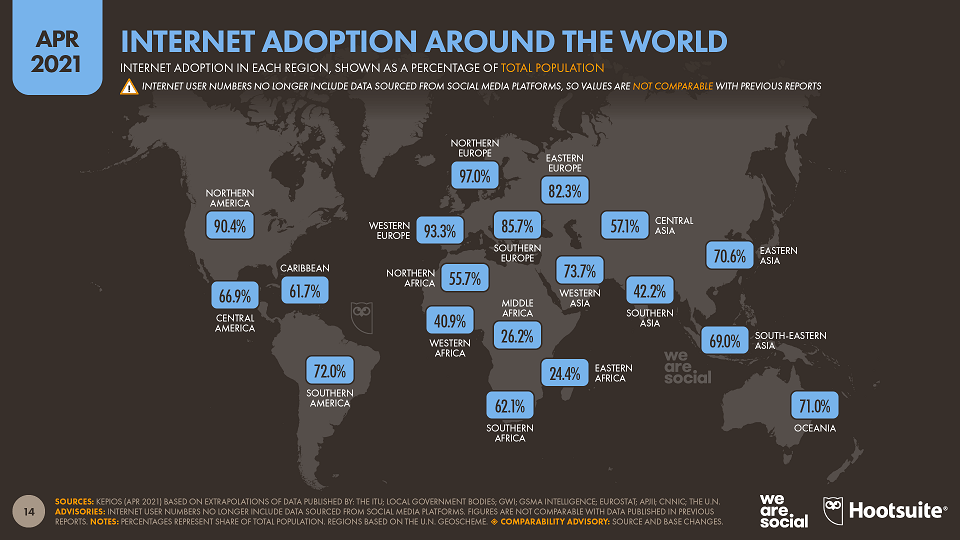
Asia has the highest number of internet users at 55% of the total population.
Iceland and Denmark are approaching the internet penetration of 100%.
1.15 billion people have access to fixed broadband internet worldwide.
Europe has the highest number of fixed broadband users at 31.9 (rate per 100 inhabitants).
US fixed broadband subscribers went from 73.05 million to 105.82 million over the last decade.
38% of users in Asia and the Middle East region use VPNs to securely connect to the internet.
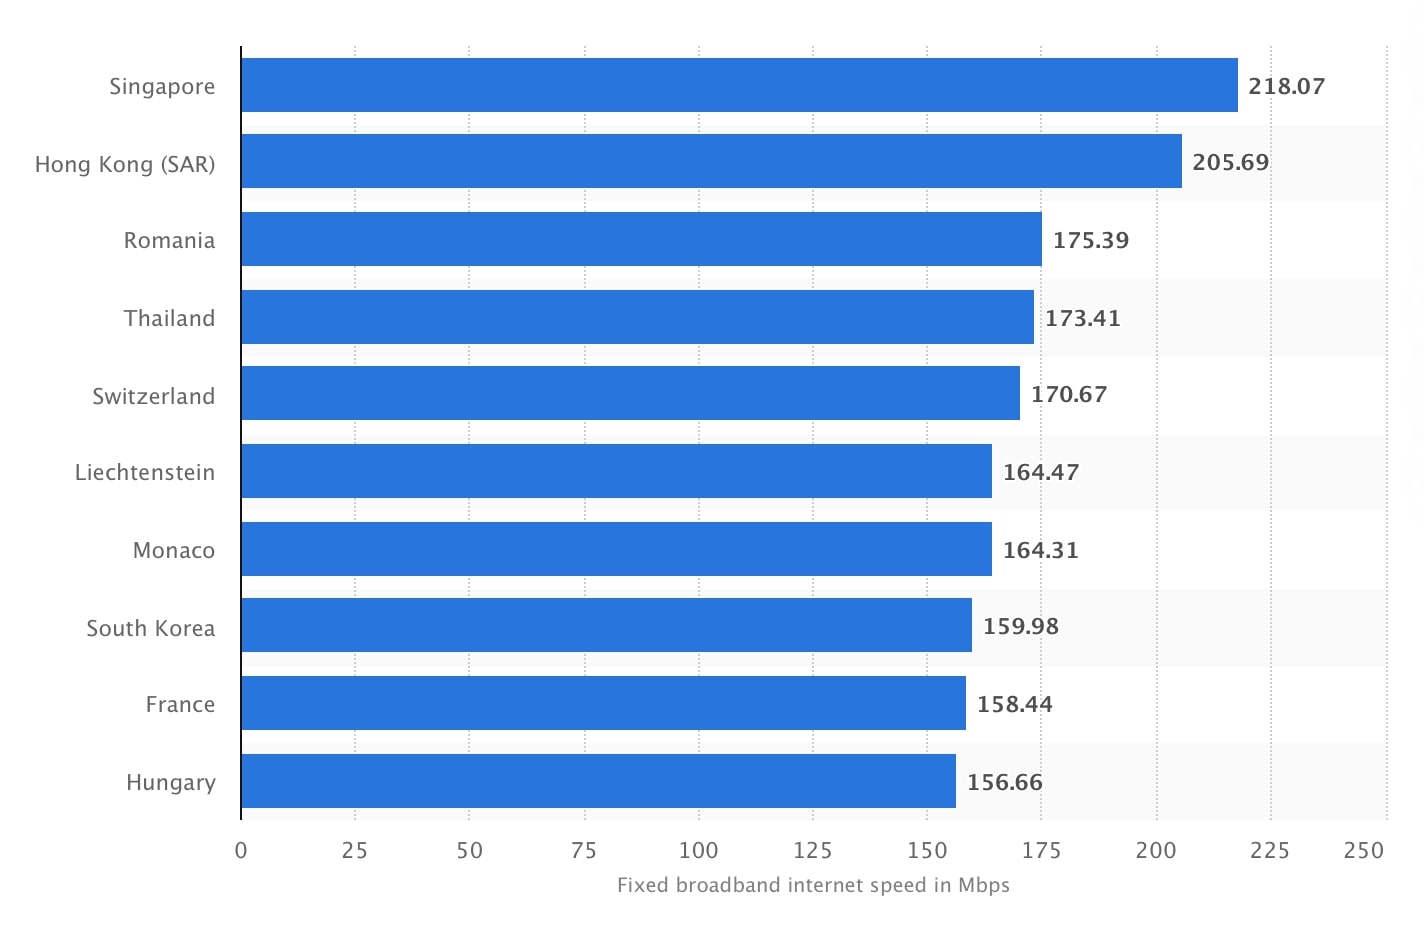

218.07 Mbps
Singapore is leading with the fastest (average) internet speed of 218.07 Mbps, followed by Hong Kong with 205.69 Mbps speed (Statista).

640,000
In the last 5 years, on average, 640,000 users started using the Internet for the first time.

30,000
More than 30,000 website hack attempts are recorded every day.

145 minutes
Internet users daily spend over 145 minutes (2 hours 25 minutes) on social media.
English is the most commonly used language on the internet.
86.6% of American households have internet access.
In the US, 98% of users aged 18 to 29 are online.

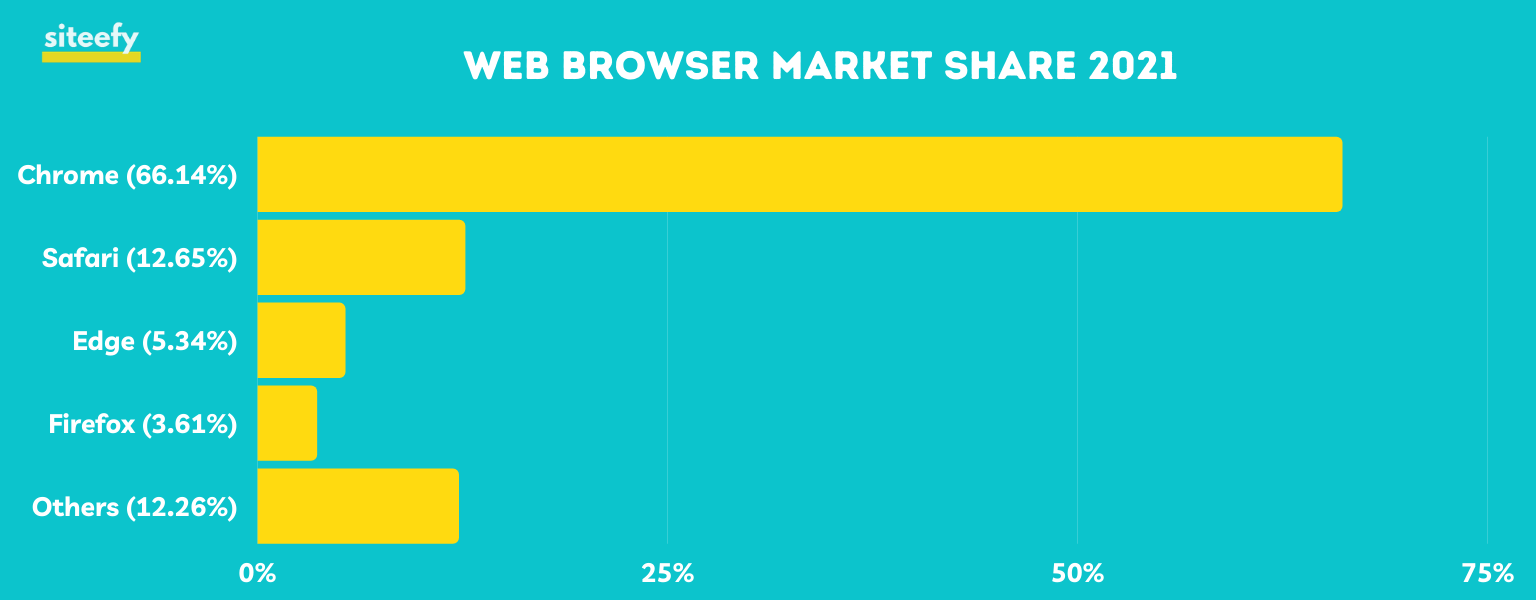
66.14%
Google Chrome is the most popular web browser with a market share of 66.14%.
Every day users spend around 6 hours and 42 minutes online (including mobile devices).
9 out of every 10 internet users watch videos online, followed by music (70%), vlogs (51%), online radio (47%), and podcasts (39%).
Safari is the second most popular web browser with a market share of 12.65%.
Video accounted for 74% of global internet traffic in 2017 and it has increased to 82% in 2020.
Chapter 2
Mobile Internet
Everything in the modern World increasingly moves towards mobile. In this chapter, we look at where mobile internet stands today and how we all use it.

99.1% of users in China use mobile phones to connect to the internet.
Mobile broadband is used by 83% of the global population.
3G mobile subscriptions increased globally from 1.15 million in 2010 to 4,287 million in 2020.

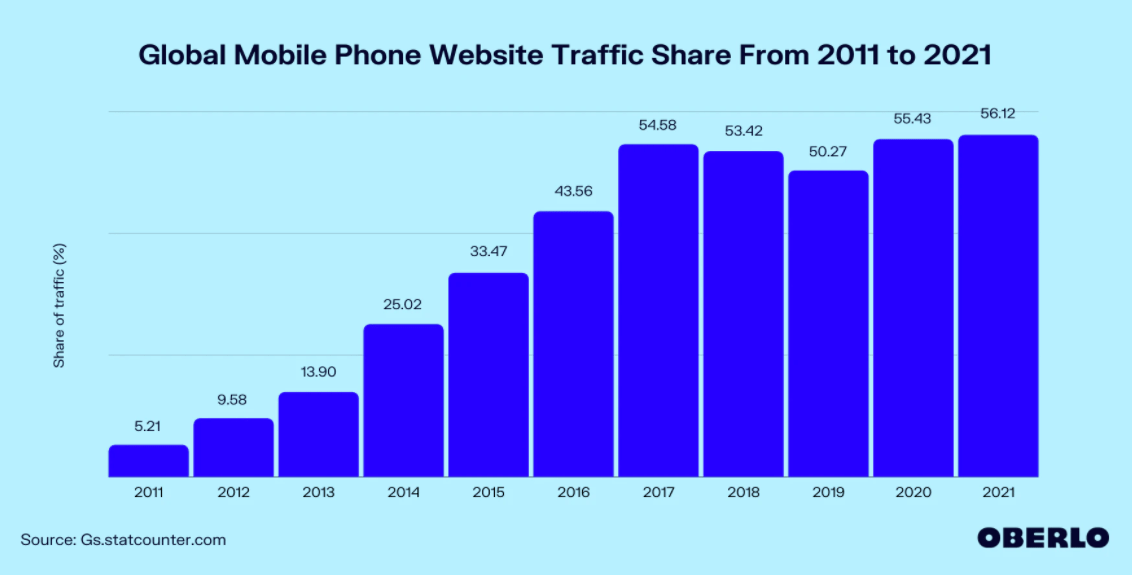
56.12%
Global mobile traffic now accounts for 56.12% of the total internet traffic.
The number of 4G mobile subscribers has increased globally from 1.18 million in 2010 to 1,812 million in 2020.
80% of internet users own a smartphone today.
The proportion of 4G connections is expected to increase from 23% to 41% by the end of the decade.

113.01 Mbps
South Korea has the fastest (average) mobile internet speed of 113.01 Mbps.

55.95%
In the US, Safari is the leading mobile web browser with a market share of 55.95%, followed by Google Chrome’s 37.17% (March, 2021).

50% Clicks
50% of all the clicks on advertisements on mobile phones are accidental.
8 out of 10 mobile phone users use either Google Chrome or Safari for web browsing.

77%
Mobile phones account for 77% of total online time in the US.
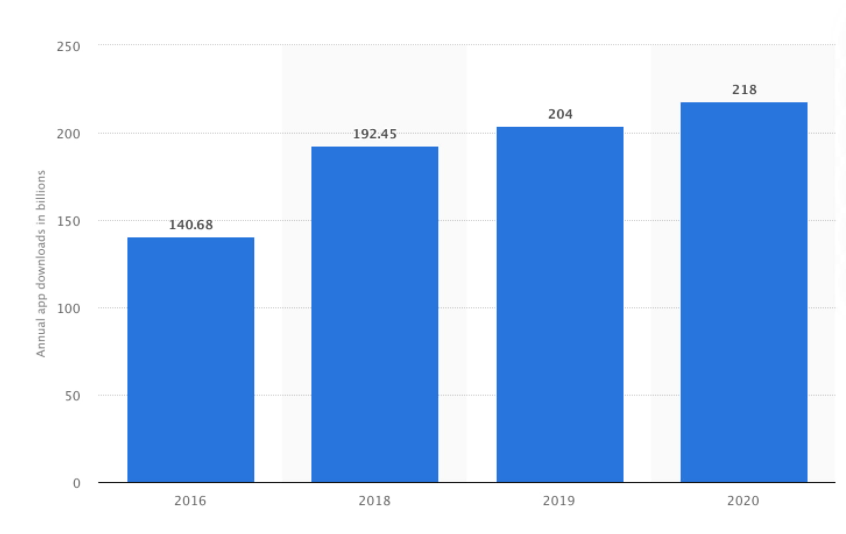
Mobile app downloads worldwide (in billions)
55% of Americans (17% of US adult cell phone owners) accessed the Internet mostly via their phones in 2012. This figure has increased to 83% in 2020 and it’s predicted to grow to 86.7% in 2023.
Gulf countries and Liechtenstein have the highest percentage of mobile Internet users – 100% (World Bank, 2019).
54% of users have access to digital content (websites, eBooks, videos, blogs, etc.) on mobile devices. Today, 25% of U.S. adults prefer reading e-books over traditional ones.
Of 42% of people who clicked on a mobile ad, 35% visited the advertiser’s page.
3 out of every 4 mobile phones use the Android operating system.
Chapter 3
Domain Names
Websites start their life with a domain name. Domains are the whole world on their own. In this chapter, we look at what the numbers tell us about the domain names in today’s Internet.

China’s ccTLD .cn is the most popular country-code domain name with 23 million registrations.
Only 8 generic TLDs (.com, .org, .net, .edu, .int, .gov, .mil, .info) are maintained by the Internet Assigned Numbers Authority (IANA).
Domain names with .com and .net TLDs have 40% (142.5 million) of all the domain registrations.

5,000 Domains
More than 5,000 new domains are registered every hour.

1,514 TLDs
There are a total of 1,514 TLDs (top-level domains) available.

$345 million
The most expensive publicly reported business.com domain was sold for $345 million.
GoDaddy is the most popular domain registrar with a market share of 15.13%.
More than 20% of domains are registered in the US.
Most common domain names TLDs are .com, .net, .org, and .co.
100,000 domain names are deleted every day from the internet.
Chapter 4
Digital Commerce
E-commerce is booming! Lockdown took this boom even further and today almost everything that can be sold online is now being actually sold online. Let’s see what numbers say today about digital commerce.

During the first quarter of 2020, more than 85,000 B2B and B2C companies set up online stores. The surge in eCommerce launches was due to the Covid-19 lockdown restrictions.
Taobao (Chinese online ecommerce company) is the most popular online marketplace with a GMV (gross merchandise volume) of 538 billion US dollars.
91% of Internet users regularly browse online stores for shopping.. Amazon ranked first with a usage rate of 52% in the search engines for shopping-related queries.
Online wallets are used for 58% of total eCommerce payments in the Asia Pacific region.
Global mobile retail eCommerce sales are expected to rise from 1.36 billion US dollars in 2017 to 3.56 billion US dollars by the end of 2021.

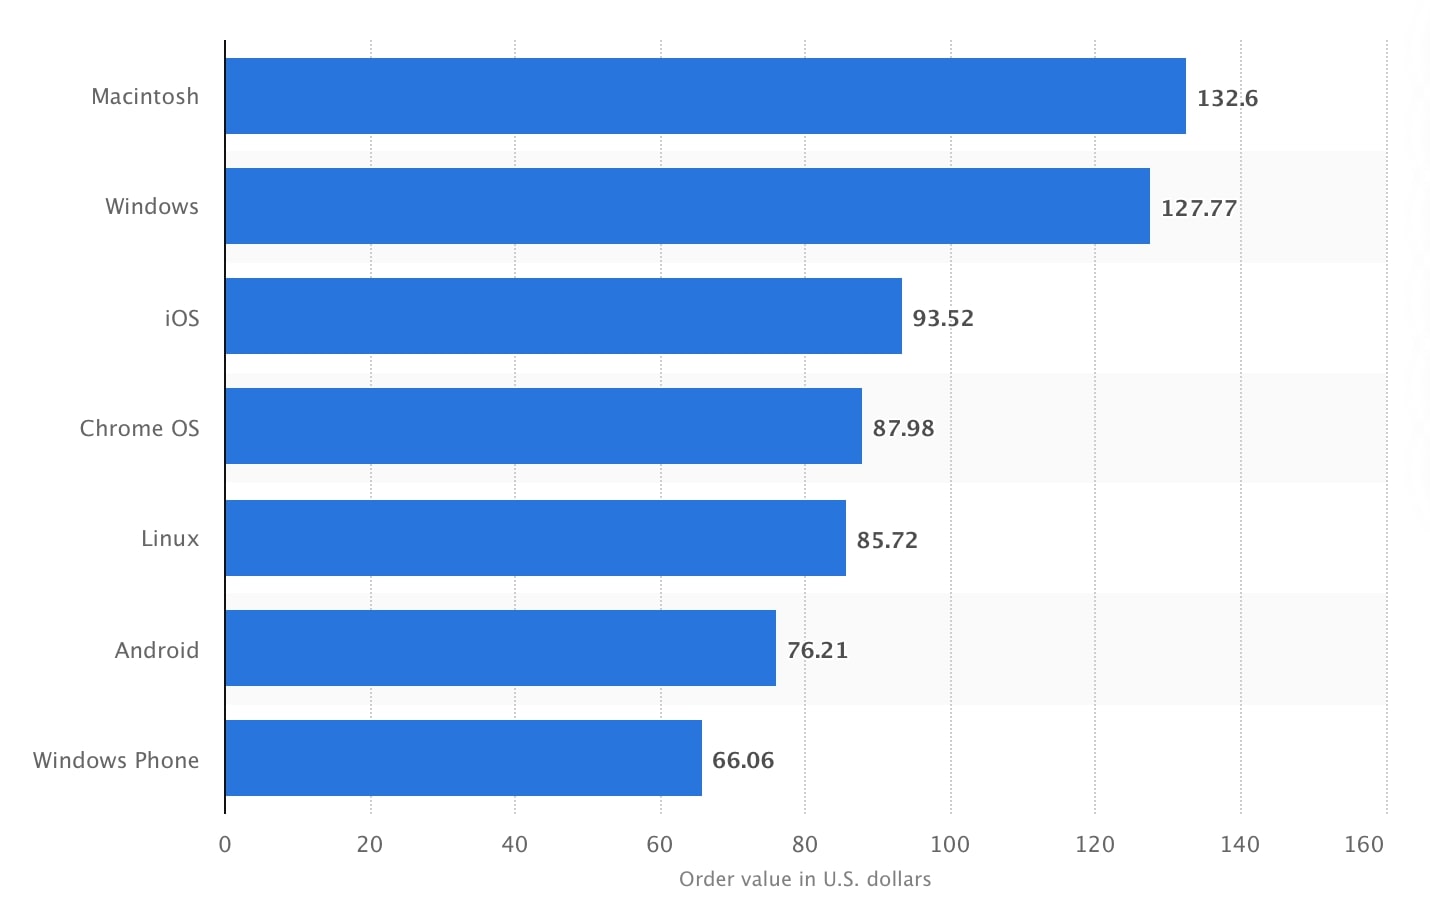
132 USD
Mac has the highest average value of online shopping orders worldwide at 132.00 US dollars.

53.9%
In the US, mobile e-commerce sales are expected to account for 53.9% of total retail e-commerce sales by 2021. That is a 19.4% increase from 2017.

65% Traffic
Smartphones account for 65% of all ecommerce traffic but generate only 46% of total online orders.

Over 40%
Digital and mobile wallets are used by more than 40% of users for online shopping.
Over 50% of Internet users now research products online before making a purchase decision.
95% of Google’s revenue is from its ads business (Google Ads).
25% of small businesses invest in digital marketing.
63% of online shoppers directly go to Amazon to search for products.
E-commerce is growing at a remarkable rate. Shopify, a giant e-commerce platform, predicts that 95% of retail purchases will be made online by 2040.
It’s predicted that E-commerce will account for 17% of the retail sales across the US by 2022.
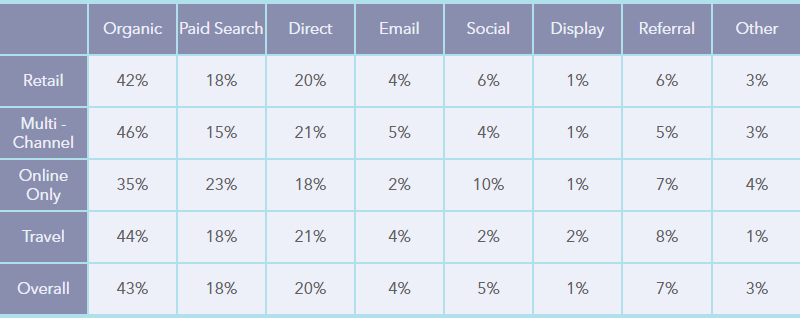

Both retail and multi-channel e-commerce stores gain most of their traffic from organic and paid search.

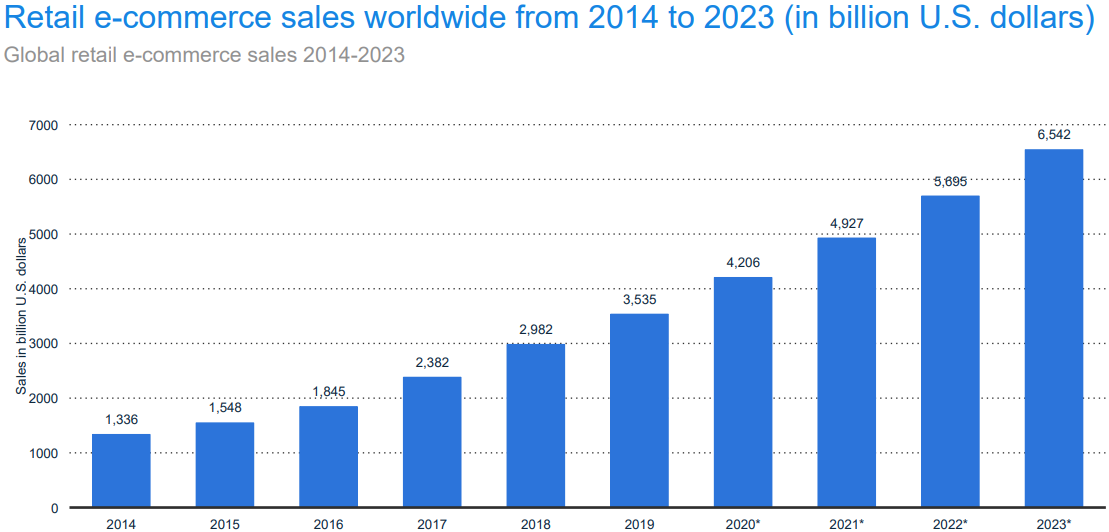
$6.54 trillion
It’s predicted that global retail e-commerce sales will reach $6.54 trillion by 2022.
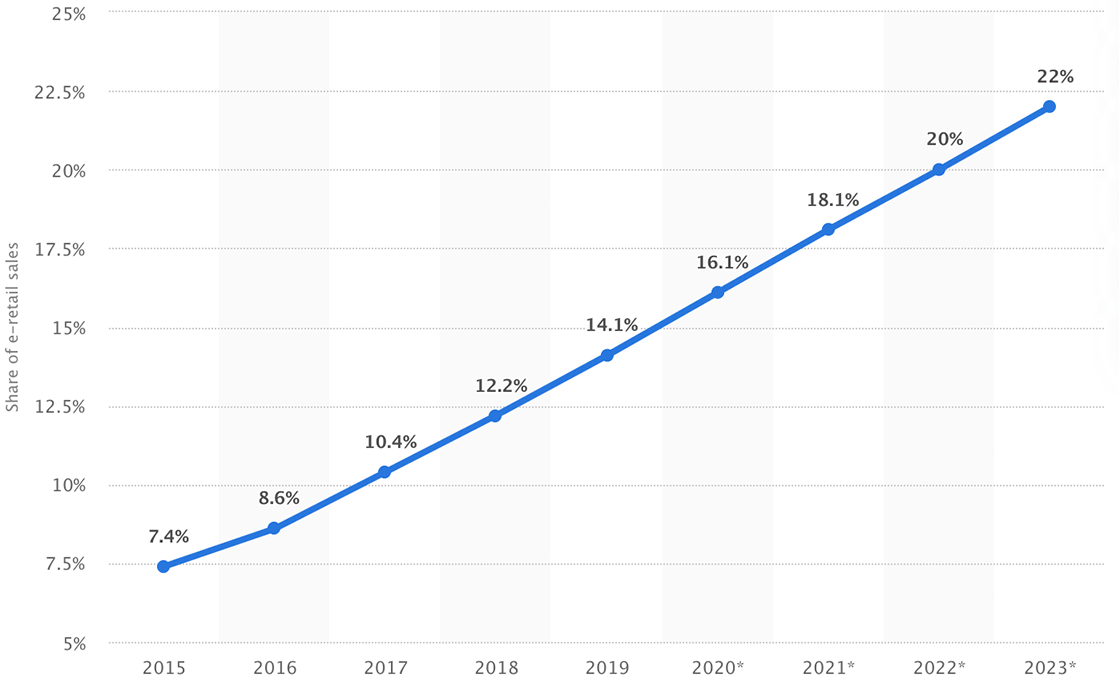

20% Sales
…and this will constitute 20% of total global retail sales (22% in 2023).

67% Millennials
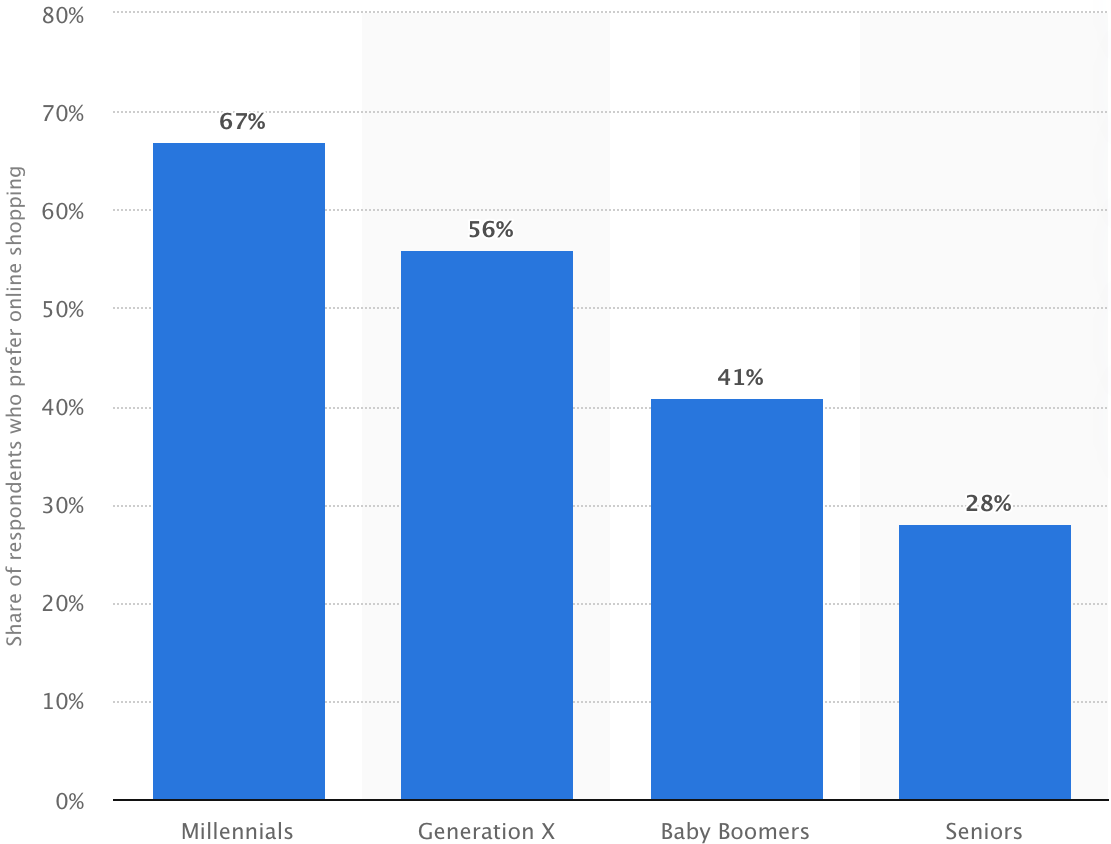
Millennials and Gen X are the most online shoppers. 67% of millennials and 56% of Gen X prefer to shop online than walking into a physical store.
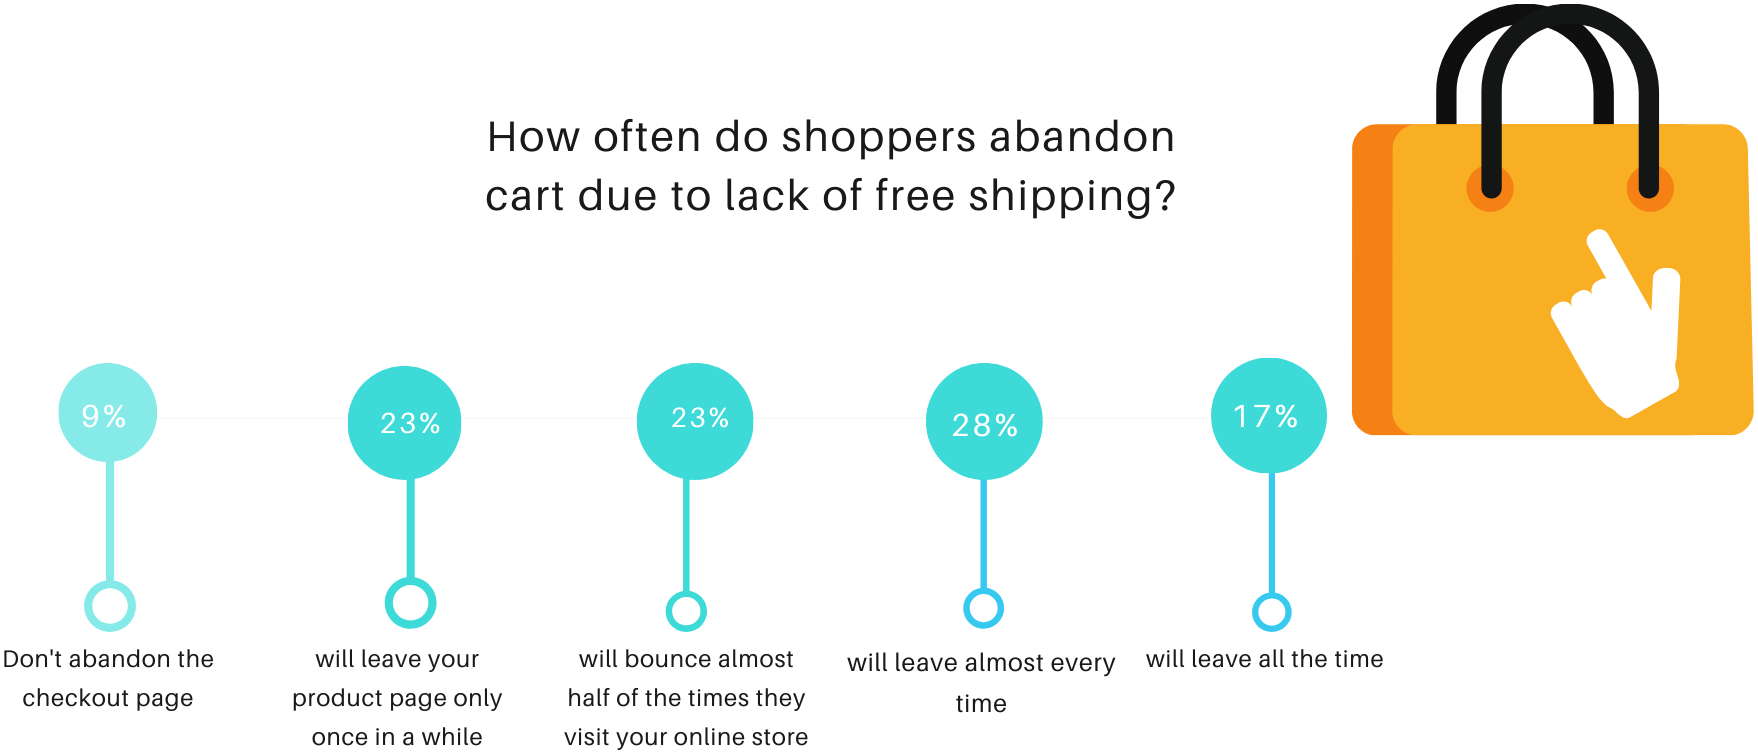

17% Bounce Rate
17% would bounce from a website if free shipping isn’t included.

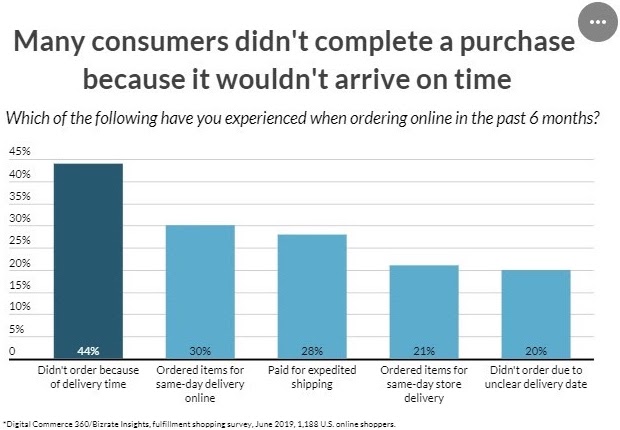
44% of Cart Abandonment
And about 44% of cart abandonment issues are attributed to long shipping times.

75% Shoppers
75% of shoppers expect the seller to offer free shipping.

2 billion
There are over 2 billion online shoppers globally.

57% Shoppers
There are now more cross-border transactions than ever before. 57% of online shoppers across different geo-locations have purchased from an overseas retailer.
Gartner, a leading research firm, predicts that 100 million shoppers will use Augmented and virtual reality to make online purchases. However, this move will highly cling to 5G technology, to improve the whole customer experience.
The typical conversion rate for e-commerce websites is anywhere between 1-2%, regardless of whether you’re working so hard to put all your marketing efforts in order.
A solid study done by DigitalCommerce 360 on consumer behavior concluded that 61% of those who completed the survey don’t shift to other online stores to compare prices or quality once they find the exact product they need.
Chapter 5
General Internet Marketing Statistics & Facts
In this chapter, we look at general internet-related stats and facts that don’t fall into other chapters.

Over 75% of digital marketers admit that internet advertising campaigns have directly increased their companies’ target revenue.
Global ad spend fell by 8.8% last year and it is expected to recover to 5.8% growth in 2021.
As of February 2021, CMO’s in the US increased their digital spend by 14%, compared to preceding 12 months.
The number of Digital Advertising Agency businesses in the US has grown from 1,449 up to 5,585 over the last decade.
Mobile ad spending worldwide amounted to 189 billion US dollars in 2020 and it’s predicted to reach 247 billion US dollars in 2022.

$74.96 billion
A report from The Drum predicts that the market for digital marketing software will reach $74.96 billion by 2022.

44% by 2021
Social video ad spending of businesses in the US alone is expected to increase 44% by 2021.
Content Marketing Statistics & Trends
More Content Marketing Statistics and Data is available here.
Websites running blogs have 55% more visitors and 97% more inbound links.
According to stellar stats from the Content Marketing Institute (CMI), 91% of B2B companies use content marketing as a strategic approach to reach their target customer base.
61% of U.S. online shoppers have made a purchase based on positive reviews from a blog.

42% Marketers
Only 42% of marketers are confident that their content marketing efforts could yield solid results.

1142 words
A report from Orbit Media suggests that an average blog post should be around 1142 words long.

60% Marketers
60% of B2B marketers upload at least one piece of content per day.

76% Marketers
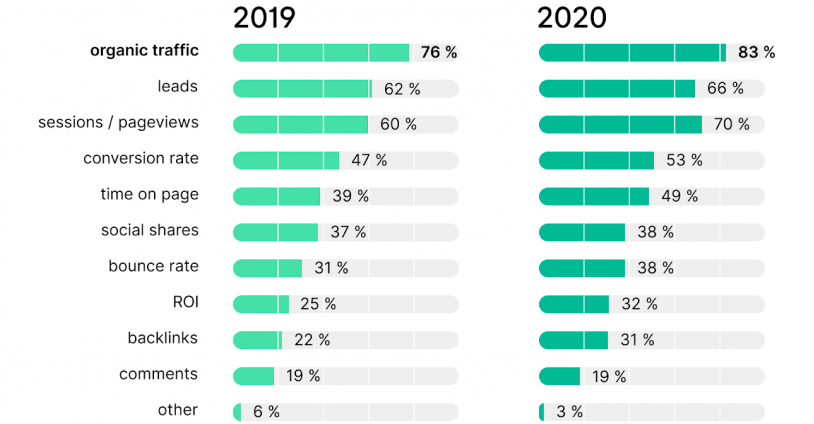
76% of marketers in 2019 and 83% of marketers in 2020 voted for organic traffic to measure the success of their content marketing efforts.
Content marketing generates three times more leads than paid ads, according to a report from the Content Marketing Institute. It also costs 62% less than the old forms of advertising.
65% of people are visual learners and are more likely to remember content that’s presented using infographics.
Blog posts with title lengths between 6-13 words garner the most traffic.
77% of internet users actively read blogs.
The decision from 61% of consumers to make a purchase is highly driven by custom content, according to Dragon Search Marketing.
Companies using content marketing increase their overall conversion rate by more than 6x, compared to those that use traditional methods.
58% of marketers say that original written content is the most valuable digital asset in their organization.
B2B marketers spend 39% of their internet advertising budget on content marketing since it’s the most effective medium.
SEO & Voice Search Statistics
More Voice Search Statistics and Data is available here.
In 2016, 22 percent of all local searches were voice searches. By the end of 2020, over 50% of all search queries are predicted to be voice-based.
And in the US alone, it’s predicted that voice-based e-commerce sales will hit $40 billion by 2022.
According to Ahrefs, featured snippets increase the click-through rate of low-ranking pages by 8.6%.
Companies that appear on the first page of the search engine gain about 92% of traffic from potential shoppers.
69.7% of search queries contain 4 words or more.
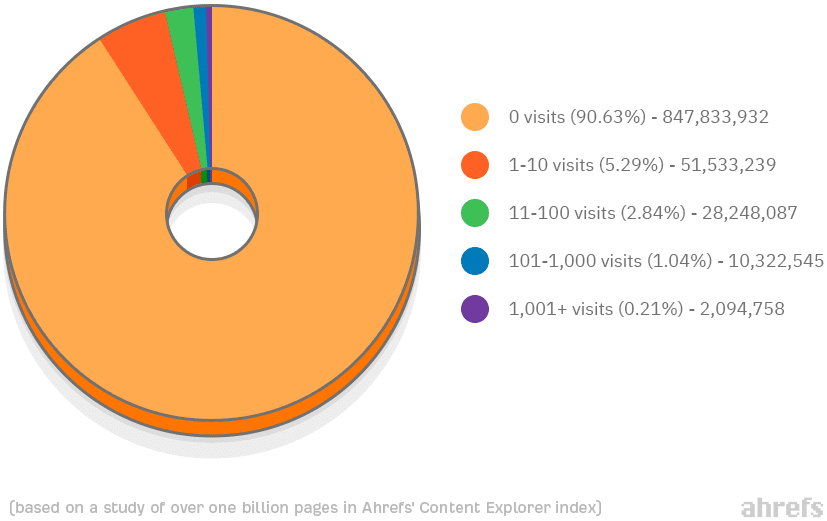

90.63%
90.63% of pages don’t get any organic traffic from Google.

92.96%
About 92.96% of global internet traffic largely comes from Google Images, Google Maps, and Google Search, according to a report from SparkToro.

1000%
SEO drives over 1000% in search traffic than organic social media marketing.

88.00%
Local SEO significantly helps drive shoppers to your business. There’s an 88% chance that consumers who visit a local site via mobile, will contact the business within 24 hours.
Slightly over 61% of online businesses highly regard the great need to create solid brand awareness using SEO.
Effective SEO leads have the potential to achieve a 14.6% conversion rate.
According to Marketing Sherpa, about 46% of B2B marketers consider optimizing landing pages for SEO quite impactful, especially during the entire lead generation process.
9th grade is the typical reading level of a voice search result.
Off-page SEO techniques such as backlinks, social media promotion, and guest contributions tend to boost your site’s rankings by 75%.
Your brand’s reputation is the king. About 9 out of 10 (93%) consumers globally, read online reviews before making a decision to purchase from your online store.
If your site isn’t mobile-optimized, there is a high chance you might lose out on a lot of potential shoppers. About 51% of consumers trust mobile-friendly websites.
Most visitors don’t spend so much time on promoted content. Organic SEO proves to be 5 times more effective than PPC advertising, and 70% of clicks are usually organic results.
Chapter 6
Social Media Marketing Statistics & Trends
Social media is a huge part of the Internet. In this chapter, we look at the latest statistics and trends in the realm of social media.

While Facebook launched Instagram Reels – a platform that will help brands create short and engaging videos, it’s predicted that 83% of the global internet traffic will be video content by 2022.
81% of businesses would consider marketing their products or services on Facebook using videos.
The number of photos uploaded daily to social media was 1.8 billion in 2014, and Facebook was among the top three social platforms driving image uploads. Today, Facebook is still one of the most used platforms, where people upload and share on average 350 million images per day.
98.3% of users access social media using a mobile device.
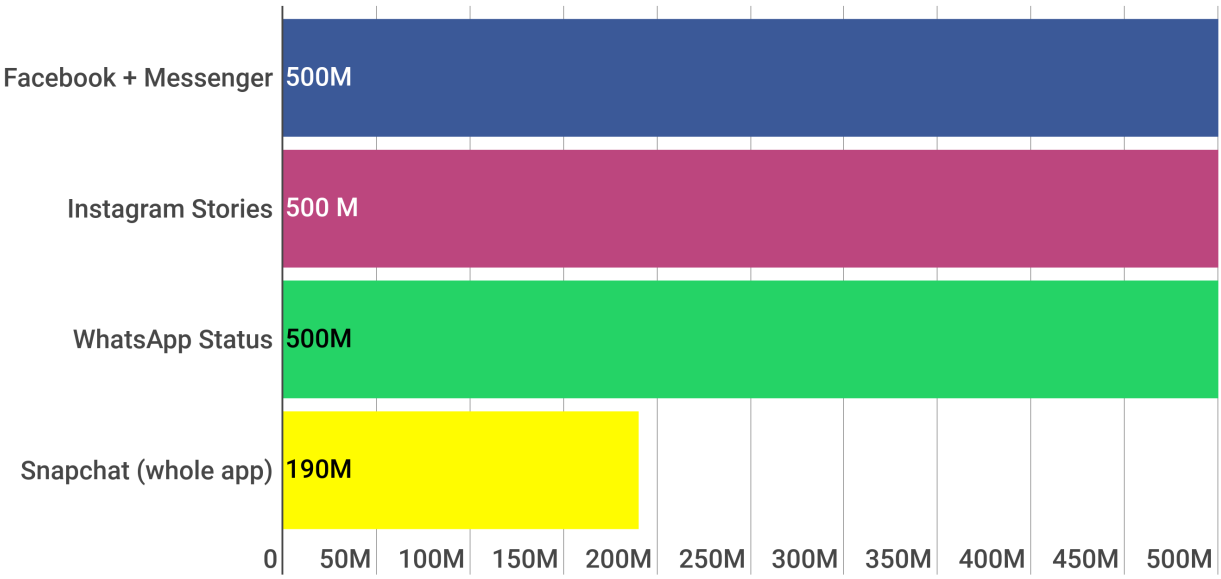

500 million
Instagram, Facebook, and WhatsApp stories, all have the same number of daily users.

2.89 billion
Facebook is the biggest social marketing platform for businesses. So far, there are about 2.89 billion monthly active users on Facebook, according to a report from Statista.

87% Marketers
Predictions from eMarketer show that 87.1% of marketers will use Facebook to promote products and services in 2020, while the global ad spending on the social platform is expected to reach almost $95 billion in 2021.
Instagram Stats
More Instagram statistics and data is available here.
72% of teenagers use Instagram, while 69% use Snapchat most often. In the US, 32% of teenagers list Instagram as the most important social network. In this sense, Instagram is ahead of all other social media platforms.
Businesses with a social presence on Instagram get around 37% of total impressions from Instagram stories.
A report from Digiday, a digital marketing publication, shows that ad spending on Instagram is higher than Facebook by 23%.
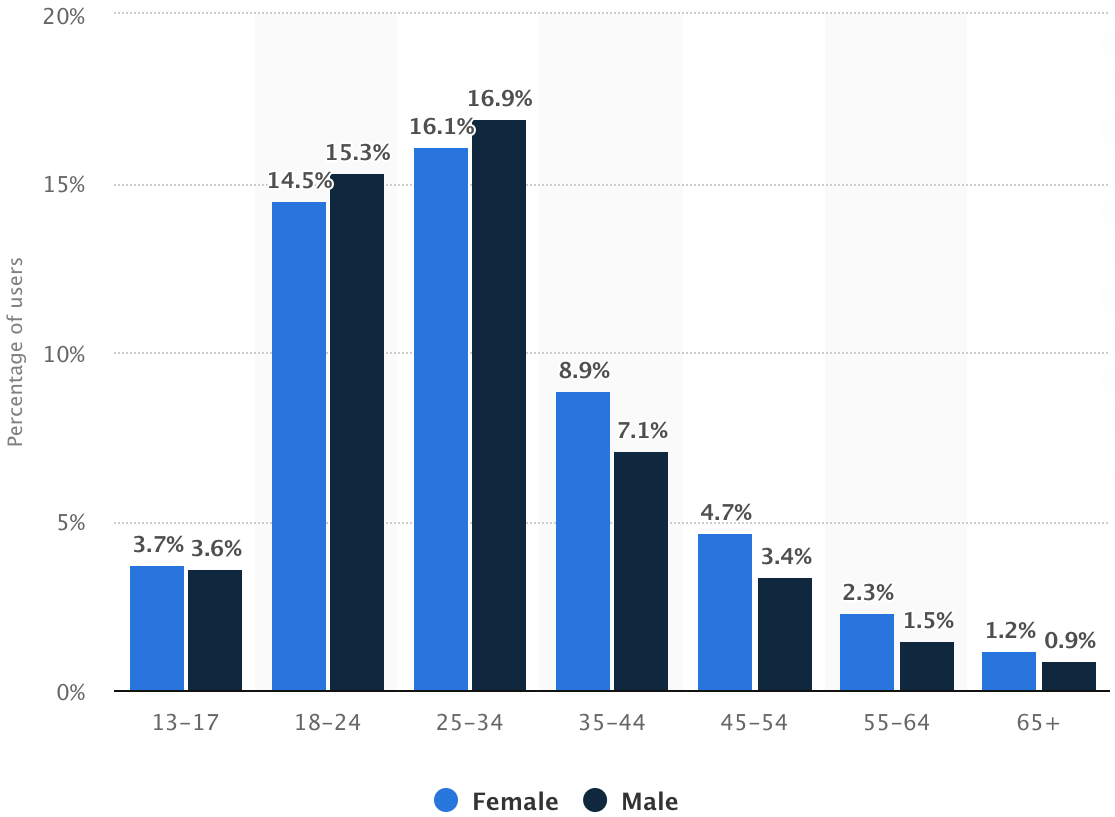

64% Users
64% of Instagram users are below 34 years old.
Over 1 billion people actively use Instagram every month.
LinkedIn Stats
LinkedIn has close to 700 million active users, as of April 2020. It’s predicted that the number will grow 4.2% in 2021 to 64.7 million more users.
The LinkedIn Marketing Solutions section grows 44% year-after-year.
57% of LinkedIn users are male while 43% are female, according to a gender demographic report by Statista.
LinkedIn revenue has been constantly increasing at a rate of 21% every single year.
94% of B2B marketers use LinkedIn to share their content.
Twitter Stats
Twitter has made 87% of its revenue through advertising services.
38% of marketers are planning to use Twitter as part of their video marketing medium.
20% of people with smartphones in the US use Twitter every month.
67% of all B2B marketers are using Twitter to achieve their digital marketing efforts.
Roughly, 63% of Twitter users globally are of the age between 35 and 65 years. Compared to Instagram and Snapchat where the average age demographic is widely filled with teenagers and Millennials, Twitter seems to appeal to an audience that’s considerably older.
Email Marketing Statistics
Message customization is the leading strategy used by marketers to boost target audience engagement.
While users read 57% of their personal emails, they only consider 37% of them useful.
87% of marketers use email marketing as a content distribution channel.
There’s an 82.57% chance users will open a welcome email, but the click-through rate will only reach 22.76%.
Emails with customized subject lines boost the open rate by 50%.

3.9 billion
Today, there are about 3.9 billion email users and the number is set to reach 4.3 billion by 2023.

ROI of $42
For every $1 you spend on email marketing, chances are you’ll roughly rake in an ROI of $42.

81% of SMBs
81% of SMBs still depend on email marketing as their customer acquisition technique, while 80% believe it’s perfect for retention.
Embedding videos on promotional emails increases the click-through rate by 300%.
51% of consumers prefer if companies contacted them via email, even more so, when the message is personalized.
40% of marketers admit that email marketing is the most effective medium to boost lead generation quality.
Marketers prefer to send between three-to-five emails to their customers every week.
There’s a 69% chance a customer will place an order if you send three cart abandonment recovery emails.
49% of customers would love to receive promotional emails from their favorite brands every week.
Affiliate & Influencer Marketing Statistics
71% of consumers will unfollow an influencer using fraudulent techniques to gain popularity, say, buying fake followers.
91% of consumers admit that a positive online review would influence their purchasing decision.
89% of marketers admit that the ROI of influencer marketing is much better in comparison to earnings from other marketing techniques.
78% of marketers consider sponsored Instagram posts as the most popular format for influencer marketing and audience engagement.
About 44% of Generation Z depends on influencers to make a buying decision.
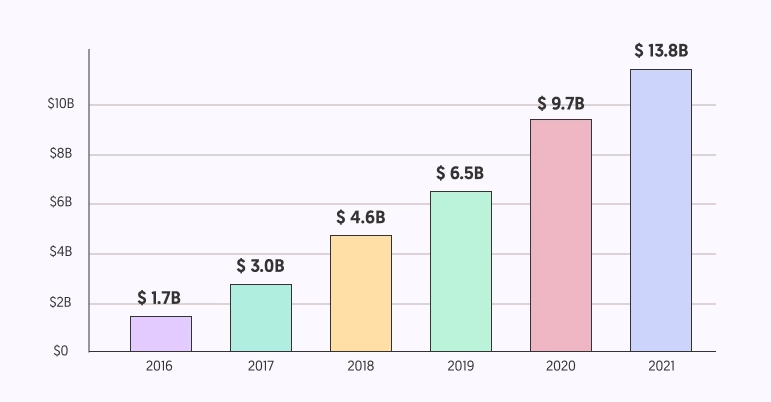

$13.8 billion
Almost two-thirds (65%) of marketers are planning to increase their influencer marketing budget in 2020. The budget was expected to hit $13.8 billion last year.

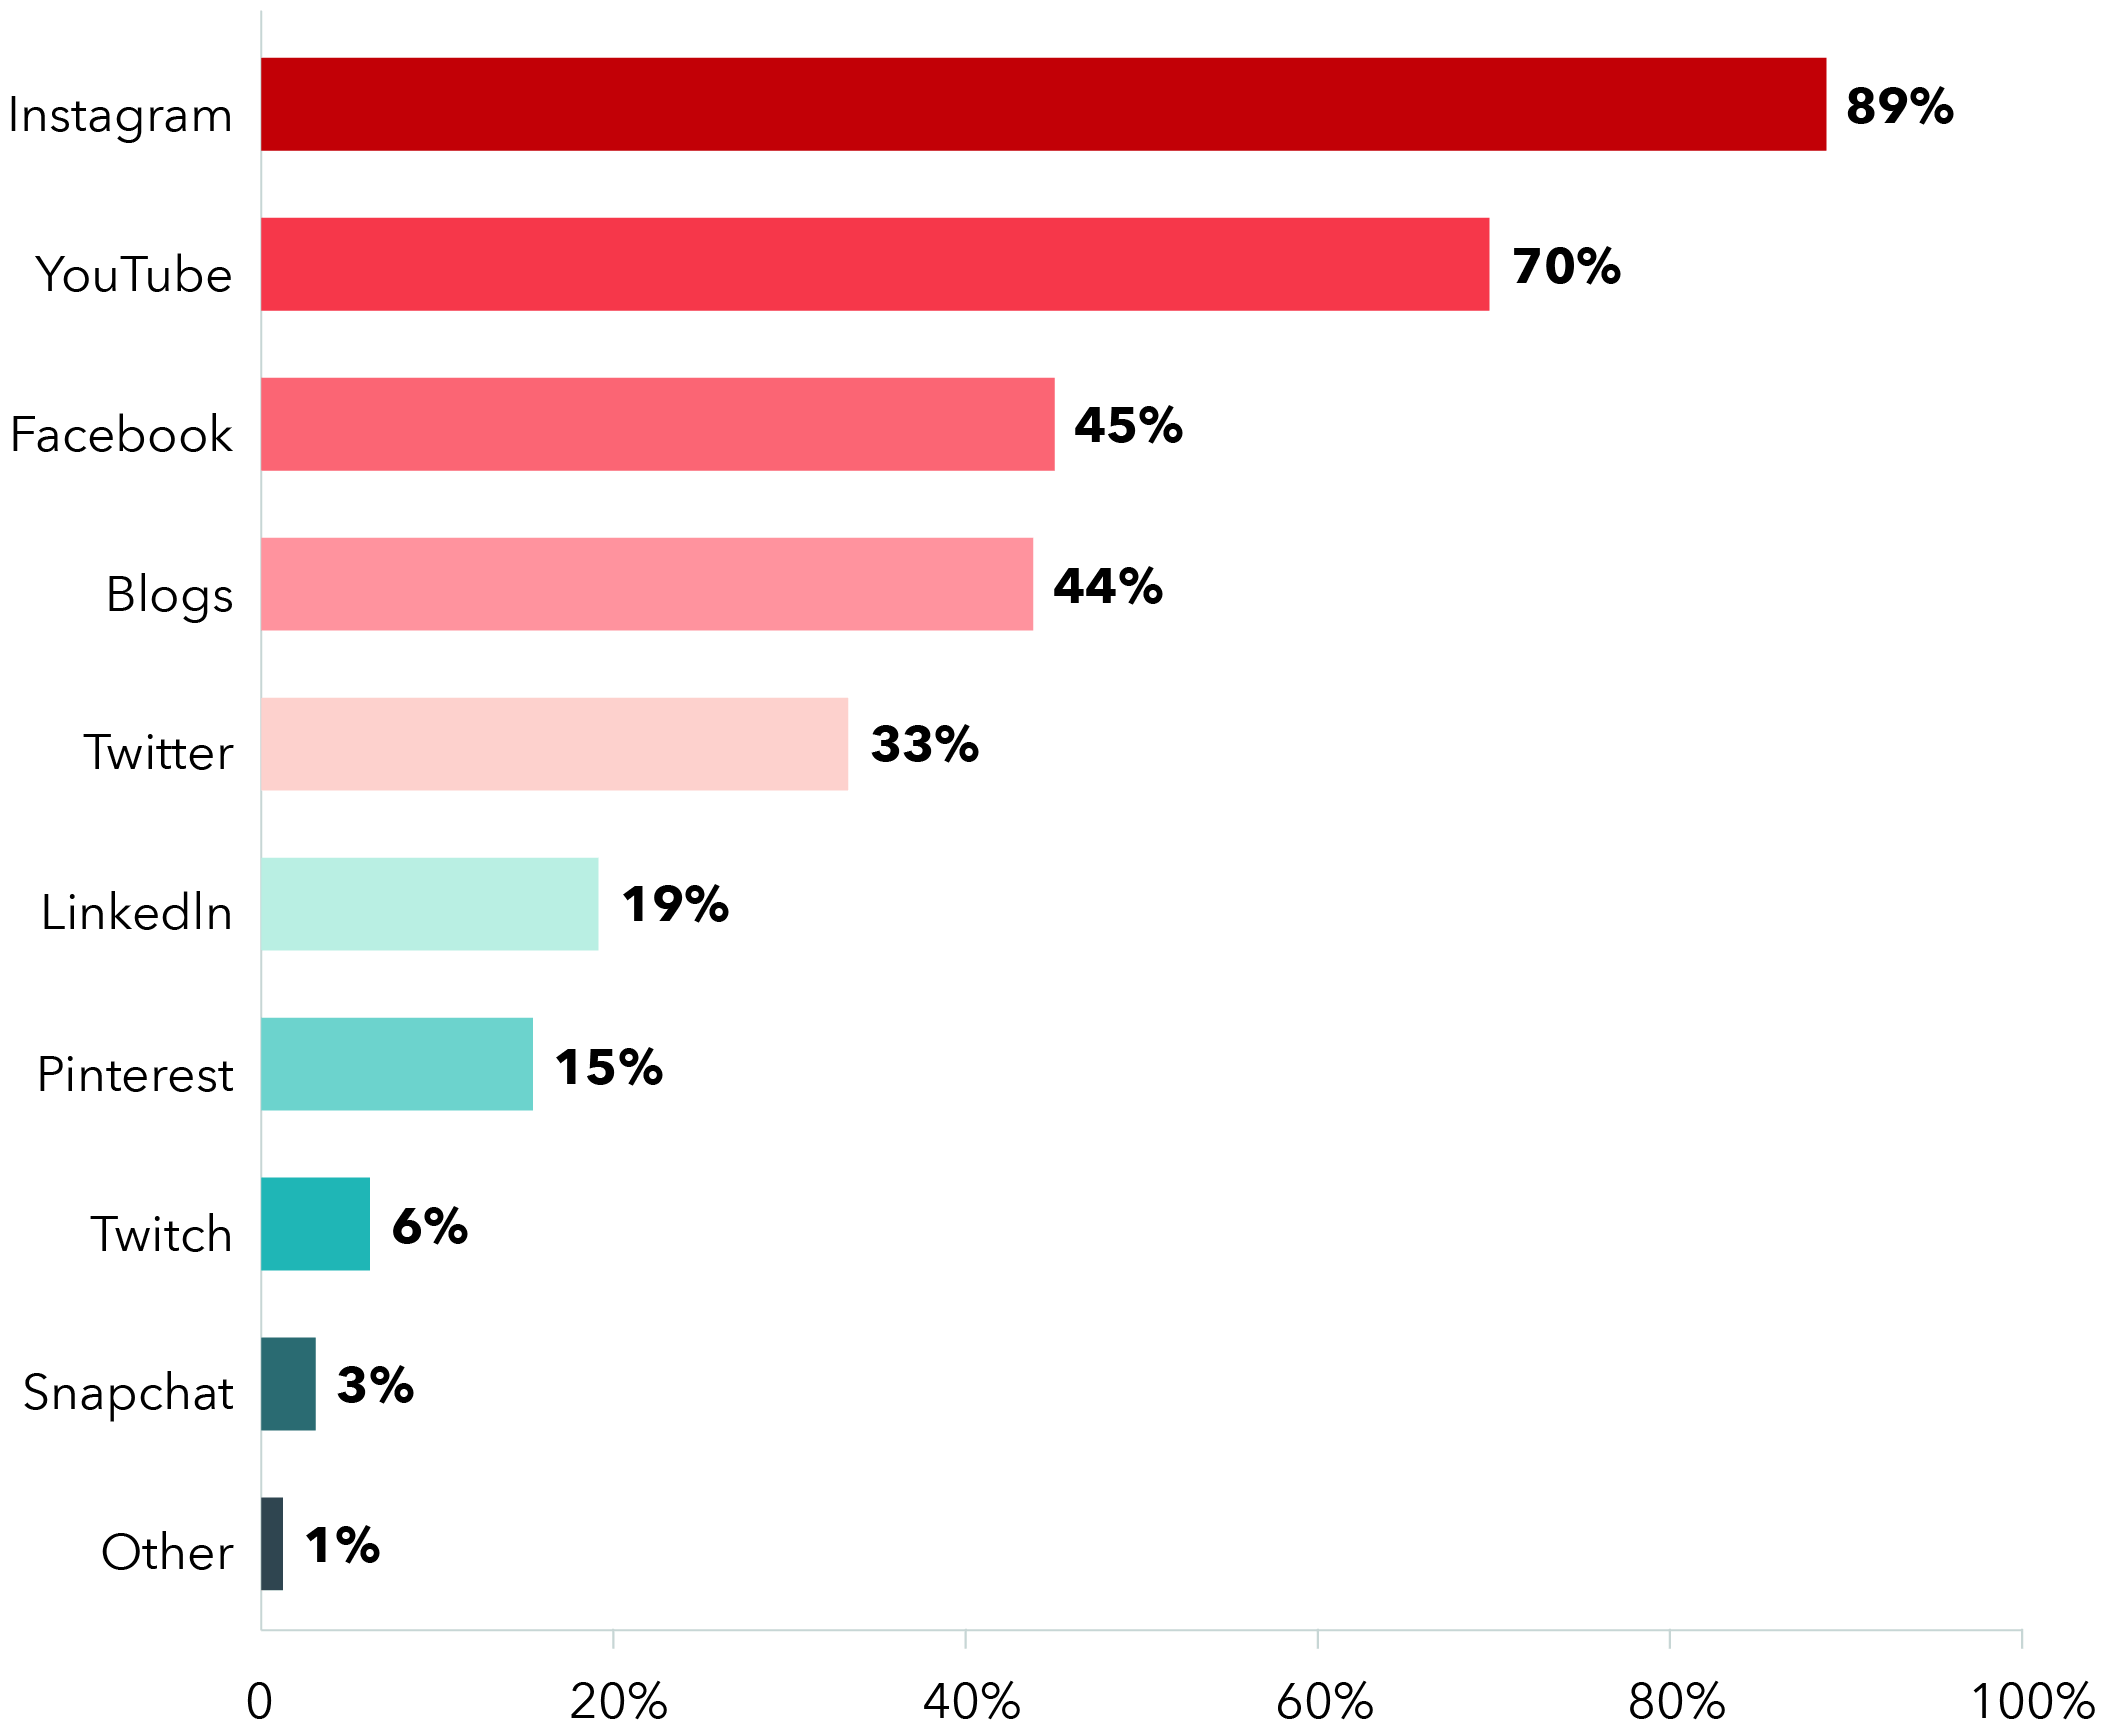
89%
Instagram (89%) tops the list as the most effective social media channel for influencer marketing

Influencer referrals also help boost sales. 82% of consumers say they would make a purchase based on a recommendation from a micro-influencer
70% of millennials who are subscribed to YouTube channels trust influencers a lot more than celebrities.
Paid Advertising/PPC Statistics & Trends
A third (33%) of Internet users would click on an ad because it faultlessly answers their search query.
Paid search advertising on mobile devices is set to hit $240 billion by 2022.
By 2021, global digital advertising across all social platforms will reach $375 billion.
After hitting pause on ad spending, 89% of the traffic generated won’t be replaced by organic results.
63% of mobile users said that they would click on a Google ad.
50% of visitors that arrive at a retailer’s product page via a paid ad link are more likely to purchase a product or service than organic visitors.
Conclusion
In the last few decades, the Internet has opened up a new world for many people worldwide.
A few more internet statistics: it is estimated that by 2021, over 2.14 billion people globally will buy products and services online, up from 1.66 billion digital buyers in 2016.
So, it’s no secret that there’s massive potential on the Internet. The good news is that you can unlock a lot of opportunities (like starting a personal or business website) the Internet provides with the help of data we have provided in this post.
Statistics Sources
- Statista
- World Bank
- Internet World Stats
- BroadbandSearch
- DataReportal
- HubSpot
- Ahrefs
- SEMrush
- Backlinko
- WordStream
- KPCB
- https://wearesocial.com/blog/2021/04/60-percent-of-the-worlds-population-is-now-online
- https://wearesocial.com/uk/blog/2023/04/the-global-state-of-digital-in-april-2023/
- https://campuspress.yale.edu/tribune/e-commerce-will-make-up-17-of-all-us-retail-sales-by-2022/
- https://www.statista.com/statistics/272664/market-share-held-by-mobile-browsers-in-the-us/
- https://www.statista.com/statistics/271644/worldwide-free-and-paid-mobile-app-store-downloads/
- https://www.statista.com/statistics/617136/digital-population-worldwide/
- https://www.statista.com/statistics/379046/worldwide-retail-e-commerce-sales/
- https://www.statista.com/statistics/806323/mobile-retail-commerce-revenue-worldwide/#statisticContainer
- https://www.statista.com/statistics/693449/digital-vs-traditional-marketing-budget-change-according-to-cmos-usa/
- https://www.statista.com/statistics/249863/us-mobile-retail-commerce-sales-as-percentage-of-e-commerce-sales/
- https://www.statista.com/statistics/303817/mobile-internet-advertising-revenue-worldwide/
- https://www.statista.com/statistics/433871/daily-social-media-usage-worldwide/
- https://www.statista.com/statistics/264810/number-of-monthly-active-facebook-users-worldwide/
- https://gs.statcounter.com/os-market-share/mobile/worldwide
- https://domainnamestat.com/statistics/overview
- https://fortunly.com/blog/the-most-expensive-domain-names-ever-sold/
- https://internetretailing.net/covid-19/covid-19/85000-businesses-launch-online-shops-as-b2c-and-b2b-ecommerce-surge-in-lockdown-21639
- https://insights.digitalmediasolutions.com/articles/digital-advertising-growth-2020
- https://trends.builtwith.com/cms
- https://joelhouse.com.au/blog/seo-statistics/
- https://contentmarketinginstitute.com/wp-content/uploads/2017/09/2018-b2b-research-final.pdf
- https://digiday.com/marketing/after-hitting-pause-on-ad-spending-advertisers-figure-out-how-to-proceed/
- https://www.smartinsights.com/
- https://www.digitalcommerce360.com/2019/12/23/2019-ecommerce-in-review-consumer-insights/
- https://www.mckinsey.com/business-functions/marketing-and-sales/our-insights/why-marketers-should-keep-sending-you-emails
- https://www.emarketer.com/Report/Worldwide-Ad-Spending-eMarketers-Updated-Estimates-Forecast-20162021/2002145
- https://quoracreative.com/article/mobile-marketing-statistics
- https://unbounce.com/ppc/seo-vs-ppc-infographic/
- https://clutch.co/seo-firms/resources/approach-search-marketing-ppc-advertising-seo-services
- https://www.getresponse.com/resources/reports/email-marketing-benchmarks
- https://www.askmedigi.com/googleads-ppc-newupdate-2020-statistics/
- https://www.smartinsights.com/online-pr/influencer-marketing/71-of-consumers-will-unfollow-influencers-with-fake-followers/
- https://sproutsocial.com/insights/instagram-stats/
- https://www.irpcommerce.com/en/gb/ecommercemarketdata.aspx
- https://www.thedrum.com/news/2017/11/30/global-digital-marketing-software-industry-set-reach-7496bn-2022
- https://mediakix.com/influencer-marketing-resources/influencer-marketing-roi/
- https://www.thinkwithgoogle.com/marketing-strategies/video/youtube-stars-influence/
- https://www.mobilemarketer.com/news/gen-z-relies-on-influencers-for-purchase-decisions-kantar-says/573264/
- https://www.martechadvisor.com/articles/marketing-automation-2/personalization-and-optimization-will-be-the-focus-for-email-marketers-in-2017/
- https://www.omnisend.com/blog/ecommerce-email-marketing-statistics-infographic/
- https://www.data-axle.com/resources/news-media-coverage/data-personalized-email-subject-lines-boost-open-rates-by-50-percent/
- https://en.wikipedia.org/wiki/List_of_countries_by_number_of_Internet_users
- https://datareportal.com/reports/digital-2021-china
- https://www.ibisworld.com/industry-statistics/number-of-businesses/digital-advertising-agencies-united-states/
- https://www.oberlo.com/statistics/mobile-internet-traffic
- https://www.dentsu.com/uk/en/media-and-investors/ad-spend-report-2021




Hurrah, that’s exactly what I was searching for!
I LOVE reading statistics! They are so fascinating and informing, and these taught me so much that I didn’t know. I had no idea that so many people searched with their VOICE, that’s so interesting. I don’t think I’ll ever do that myself, but I’ll have to keep that in mind when using my own blog and social media accounts. I also didn’t realize GoDaddy was so popular; I might have to look into them in the future!
That’s crazy that there are so many domains registered every hour! I know a lot of people that register a lot of domains even if they aren’t planning on using them.
Nice work